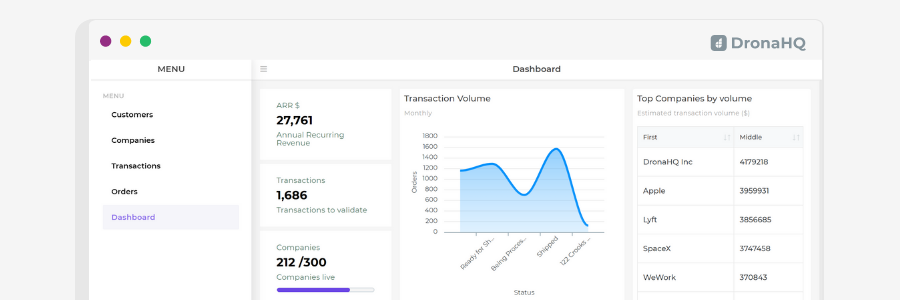

How to build an Admin Panel on top of Airtable
This article walks us through the process of creating an admin panel and sales dashboard on top of Airtable data. Using the ready connector to Airtable in DronaHQ, we will be integrating with the customer database present in Airtable and notify the admin or sales managers on Slack every time a new customer is added to the database.
Building an Airtable Admin Panel
The Admin Panel is the fundamental tool for working with your online store. Using this internal tool, you can manage products and orders, offer discounts, interact with your customers, and do much more.
Using a custom internal tool like an admin panel, you can turn your Sales figures, Inventory, Customer database stored in Airtable to actionable insights and dashboards. It can also be used to export weekly/monthly/yearly data to create reports.
An Airtable Admin panel will increase productivity, give insight into data, and help you catch the pain points of any particular team or employee, further leading to greater revenue for your company. By investing in an Airtable admin panel early, you will establish an efficient business and allow your workforce to do what they need to make your company grow.
With DronaHQ, you can:
- Create multiple views in your Airtable GUI so different users will see only the data intended for them
- Manage user access to define view and edit rights using roles based as well as user based permissions
- Create filtered Airtable client views by defining on-screen rules.
- Search and filter your Airtable data and data sets depending on pre-defined filter parameters
- Manipulate your Airtable data, edit or delete data through the Airtable GUIs
- Combine Airtable data with information from other platforms like Google Sheets, Zendesk, HubSpot, Salesforce and lots more.
To follow along with this tutorial, login to connect Airtable database now
How to integrate your Admin Panel, Admin Client, Dashboard, Internal Tool, or GUI with your Airtable account on DronaHQ?
DronaHQ has many ready connectors that will easily integrate with the apps you use in your everyday work. For this use case, we will use Airtable connector and Slack connector.
Let’s get started.
Step 1: Go to DronaHQ Studio > Connectors > Manage Accounts

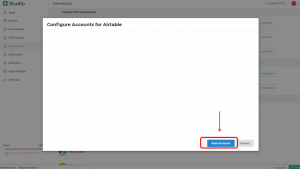
Step 2: For adding your Airtable account in DronaHQ, you need four fields: Account Name, API Key, Base ID, and Table Name.
1. Account Name: Give your account a name without any space. In my case, it was “ambar.”
2. API Key: Go to your Airtable account (airtable.com/account), and click on “Generate API Key.” This API Key will be the same for all your tables present in it.

3. Base ID: This can be accessed from airtable.com/api. Click on the base (or table) you want to integrate.


4. Table Name: This value will be the name of the base (or table) you want to connect. In my case, it’s “Classic Cars.”
Now that we have all the values for the integration, we can easily connect and use the data in our Airtable Admin Panel app.

Step 3: Now click on “Submit,” and voila! Your account will get connected to Studio.
You can now access your Airtable data to do 5 actions, allowed by DronaHQ. Those are shown in the image.

In this article, we will cover the first 3 actions.
- Find Rows: You can find multiple rows in your Airtable database, using one column to filter. It will return record IDs of all the rows found.
- Find a Row: Like the first one, it will return us only one specific record ID.
- Create Row: The integration with Airtable will enable you to add a new record (in the end) to the Airtable table.
About Airtable Database
In my Airtable database, I have various sheets, but we will use the sheets mentioned below.
1. Employees List: All the details about the workforce, starting with their employee number, name, contact info, reporting manager, job title, and more.
2. Customers List: All the customers are given a unique ID called Customer Number. Along with this, it contains the customer name, the company he/she belongs to, contact details, which sales rep is handling their orders, etc.
3. Product Types: It consists of categories under which products are distributed, for example, motorcycles, classic cars, vintage cars, buses & trucks, trains, ships, and planes. This sheet also tells us about the number of products in each category.
4. Product List: It contains all the products, along with their unique product code, name, which category it belongs to, its vendor, description, and size.
5. Orders Status: This list consists of all the orders, along with their details like customer number, ordered date, required date, order status (shipped, in-process, on hold, and more), shipped data (if shipped), and comments (if any).
6. Order Details: This list is the extended version of the previous one. It contains the breakdown of each order according to the product ID.

[Image Above]For example, there’s an order number “10101”, which contains four different products, with different quantities and prices. This list will thus show the breakdown of the order.
7. Yearly Orders: It contains the number of sales done in a month of any particular year.
8. SDR Sales: Number of sales a particular sales representative has done. It has the SDR’s name, employee number, and a number of sales done.
9. Payment Details: It has a check number, the date of transaction, and the total amount paid.
Building the Airtable Admin Panel
Step 1: Using a pre-built template
We will use a pre-built app template to give a quick start. Go to Studio > Templates > Admin Panel.
Note: These steps can also be used to build custom Airtable GUIs or a web client.
As you can see, this template will make it extremely easy to build the Airtable admin panel. It contains five sections, and we will use all of them, with slight tweaking.
Step 2: Let’s start with the Customers’ Section
The final customers’ section will look something like this:
In the customers’ screen, we need to add a formula to the table grid control present. For that, I have imported the Customers Airtable Database (CSV file) to DronaHQ Sheets.

Select the table grid control, go to BindData > Custom Formula > Edit
To display the customers’ list, we will use the LOOKUP() formula. Add the formula shown below and click on “Save and Validate”.

Syntax: LOOKUP([Sheetname.columnname],filter,sorting,order)
LOOKUP([Airtable_Customers.CustomerNumber,Airtable_Customers.CompanyName,Airtable_Customers.FirstName,Airtable_Customers.LastName,Airtable_Customers.Country,Airtable_Customers.SalesRepEmployeeNumber,Airtable_Customers.CreditLimit])
Name of the DronaHQ Sheet: Airtable_Customers
Variable Names: CustomerNumber, CompanyName, FirstName, LastName, Country, SalesRepEmployeeNumber, CreditLimit
NOTE: LOOKUP() formula is used for data present in DronaHQ Sheets. So wherever I have used it, you need to import the CSV file of the corresponding sheet.
The result shown will be similar to the image.
Here, we have not used any filter, as we want to display the whole list of customers. But, if you want to know more about the LOOKUP() formula filters, refer to this.
 In the table grid control, when you click on any one row, it gives 3 options:
- Select Row,
- Navigate with Selection, or
- Show Details.
In our case, we will use “Navigate with Selection”, which means when a row is clicked, it will take to the details of that particular customer.
For this, in the properties of the table grid, you will find a “Actions” section. You can use any action you wish to happen when a row is clicked, whether selecting or navigating to some other screen.
I have used the action to navigate it to “Customer Details”, a new screen type “Tray.” You can set the screen type from the properties section, with custom width. It will display the customer details like company name, customer contact information, the orders that particular customer has placed, and payment corresponding to those orders.


All the fields will use the LOOKUP() formula with a filter of Customer Number (match with the customer selected).
Let’s see an example, for displaying the company name:
LOOKUP([Airtable_Customers.CompanyName],Airtable_Customers.CustomerNumber = customerslist.CustomerNumber)
Where, “Airtable_Customers.CustomerNumber = customerslist.CustomerNumber” is a filter used.
To get the customer’s orders in the table grid, we will again use LOOKUP().
LOOKUP([Airtable_Orders_Status.OrderNumber,Airtable_Orders_Status.OrderDate,Airtable_Orders_Status.RequiredDate,Airtable_Orders_Status.ShippedDate,Airtable_Orders_Status.Status,Airtable_Orders_Status.Comments] , Airtable_Orders_Status.CustomerNumber = customerslist.CustomerNumber)
Where, “Airtable_Orders_Status.CustomerNumber = customerslist.CustomerNumber” is a filter used.
Similarly, can be done for the payments table:
LOOKUP([Airtable_Payment.CheckNumber,Airtable_Payment.PaymentDate,Airtable_Payment.TotalAmount] , Airtable_Payment.CustomerNumber = customerslist.CustomerNumber)
Where, “ Airtable_Payment.CustomerNumber = customerslist.CustomerNumber” is a filter used.
Further, when you click on the customer’s orders, the details of that order will be shown in a pop-up. This means all the products, their code, price of each, and quantity. The process of redirecting when clicked is similar to how we did for customer details.

The pop-up will consist of a table grid with the LOOKUP() formula and filter of Order Number (matched with the order selected).
LOOKUP([Airtable_Orders_List.Product_Code,Airtable_Orders_List.Order_Quantity,Airtable_Orders_List.Price_Each,Airtable_Orders_List.Total_Cost] , Airtable_Orders_List.Order_Number = customerorders1.OrderNumber)
Where, “Airtable_Orders_List.Order_Number = customerorders1.OrderNumber” is a filter used.
Step 3: Add a new customer

For adding a new customer, we will start by building a form. You create it from scratch or you can:
Go to +Add > Form > Select your DronaHQ Sheet (where you want the details to be added, when the form is submitted) > Select the input fields > Create.

For building a form from scratch, you can refer to this. After building the form, it looks something like this.

For, navigating from the customers’ list screen to this new form screen, I added an action button (purple one shown in the image below).

Now, we need to you can click on the action button on the screen and use action flow to navigate it to the “Add New Customer” form screen.
For navigation, Click + > Navigate To > Select the Form Screen > Continue > Give your action a name (ex: Add New Customer) > Finish.
On the same screen, we need to add workflow to handle our server-side’s requests, like updating the database with a new row of customer details.
I needed my workflow to do 3 things:
- Add the new customer details in DronaHQ Sheets.
- Adding the new customer details in the Airtable database.
- Sending a Slack message to the channel of the sales representatives, notifying them about the addition to the new customer.
For the task of adding/updating the DronaHQ Sheets in workflow, you can learn it here.
For adding a new customer in Airtable, you need to go to workflows:
Airtable > Create Row > Choose Account > Add your Base ID and Table Name (where you want to add a new row) in double quotations (“”) > Task Name > Finish
NOTE: Adding the Base ID and Table Name in (“”) is extremely important, as the values are being taken by the system as a String.
For sending a Slack notification to the SDR channel or Sales Manager, you can use this approach:
Slack > Select a Sub Category (my case — SendMessageToChannel) > Choose Account > Select Channel and write a message you want to send in double quotations (“”) > Task Name > Finish
This is how my final workflow for adding a new customer looks like:

Step 4: Products’ Section
In this screen, I have used a list card made in Designer to display different types of products.
As you can see, each card is for a category that contains a title, description, and image. When a click on any of the cards, it navigates to a screen containing a list of products in that particular category using action flows.
To add the filter in the table grid of only choosing the “Chosen” product type, you will need to configure the “Find Rows” in Airtable Connector, as shown in the video below.
Airtable > Find Rows > Choose Account > Give your connector a name (ex: FindMotorcycles) > Choose the column which should be used to initiate the search (ex: ProductType) > What value should be searched for (ex: Motorcycles) > Add your Base ID and Table Name (where you want to search for, ex.ProductsDetails) > Task Name > Finish
After adding a connector, to bind the data to the table grid control, you need the 2 functions — MAPKEYS() and BINDAPI(). The following formula is for the “Motorcycles” category
MAPKEYS( BINDAPI( [FindMotorcycles.records.fields]) , “Product_Code:Product Code, Product_Name:Product Name, ProductType:ProductType, Product_Scale:Product Scale, Product_Vendor:Product Vendor, Product_Description:Product Description, Quantity_In_Stock:Quantity In Stock, Buy_Price:Buy Price, MSRP:MSRP”)
Where, “FindMotorcycles” is the connector name, and for the rest of the formula is mapping of variables. For example, in Product_Code:Product Code, the format is destination:source. So Product_Code is the destination and Product Code is the name of the column in my Airtable Database.
A similar process can be followed for all the categories.

NOTE: The destination variable shouldn’t have any spaces, and you can name it anything, not necessarily the same name.
Read more about Airtable Integration with DronaHQ.
Step 5: Orders’ Section
The Order Section will be beneficial for the Customer Success Team.
Whenever there’s an order issue or just a simple customer request of knowing their order status, this list will be helpful. But simply entering the unique order number or the unique customer number, they will fetch the details and provide support to the customer. This will lead to faster customer handling and giving them a quick and efficient user experience.
Even a Sales Manager who wants to get any details about an order or maybe a disputed order can get it from here.
The final Orders’ section will look like this:
As you can see, the screen will display a list of orders and the status, order date, required data, customer number, and shipped date (if any). So, when an admin or sales representative or customer success member wants to check the order details for a customer, he/she can easily do it using this screen. Once you click on order, a tray screen will display its details and the customer’s basic information.
The new powerful and robust table grid control offers a quick filter option, which allows you to filter the orders according to the order status.
The process of displaying the orders’ list is similar to what we did until now. For the main table, we will use a LOOKUP() formula (shown in the image below).

For adding the tray screen, we will use a similar method as done in step 2. You can even duplicate the Customer Details screen, and tweak the formulas accordingly.
For example, for displaying the company name:
LOOKUP([Airtable_Customers.CompanyName] , Airtable_Customers.CustomerNumber = allorders.CustomerNumber)
Where, “Airtable_Customers.CustomerNumber = allorders.CustomerNumber” is a filter used.
And for order details:
LOOKUP([Airtable_Orders_List.Product_Code,Airtable_Orders_List.Order_Quantity,Airtable_Orders_List.Price_Each] , Airtable_Orders_List.Order_Number = allorders.OrderNumber , Airtable_Orders_List.unique_id , “ASC”)
Where, “Airtable_Orders_List.Order_Number = allorders.OrderNumber” is a filter used, and Airtable_Orders_List.unique_id, “ASC” is the order of display, i.e. Ascending Order.
Similarly, you can do all the fields that you want to be displayed when clicked on an order.

NOTE: You can COPY SCREEN too, but it will only copy the UI and not the formulas.
Step 6: Employees’ Section
This screen displays a list of all the employees in the organization. A new employee who wants to know an email or contact number or even a phone extension number can quickly access this and carry on with their work, rather than spending time figuring out what he/she has to work due to lack of communication.
The formula for displaying all the list of the workforce:
LOOKUP([Airtable_Employees.EmployeeNumber,Airtable_Employees.FirstName,Airtable_Employees.LastName,Airtable_Employees.JobTitle,Airtable_Employees.Email,Airtable_Employees.ReportingManager,Airtable_Employees.OfficeCode,Airtable_Employees.Extension],””,Airtable_Employees.EmployeeNumber,”ASC”)
Where, Airtable_Employees.EmployeeNumber,”ASC” is the order of display, i.e. Ascending Order in terms of the employee number.

Building Admin Dashboard
There are different reasons to create an Admin Dashboard. It is not generalized to one particular group of organizations or industries. Here are some:
- Monitor the health of a business
- Give a comprehensive view of all the data you need to make decisions on one good comprehensible screen.
- Monitor the most crucial information about the monthly or yearly operations
- Ensure that the focus of all your workforce is on the same goal through viewing and using the same information to achieve targets
For all the reasons stated above, the basic admin dashboard using Airtable integration will look something like this:
To break it down into 5 parts for easy understanding:
- Number of orders of a particular status
- Line graph for displaying the number of sales in a particular year
- Pie chart depicting the number of products in each category
- Bar graph for the number of sales each sales rep has made
- Detailed representation of the sales made by each sales representative
Step 1: Order Status Details

To display a card about order status and the number of orders, we will use “Find Rows,” Airtable connectors.
For finding orders which are “Shipped”:
Airtable > Find Rows > Choose Account > Give your connector a name (ex: FindShippedOrders) > Choose the column which should be used to initiate the search (ex: Order Status) > What value should be searched for (ex: Shipped) > Add Base ID and Table Name (ex. Order Status) > Task Name > Finish
The formula for displaying the fetched data, using MAPKEYS() and BINDAPI():
MAPKEYS( BINDAPI( [FindAllShippedOrders.records.fields]) , “Order_Number:Order Number, Customer_Number:Customer Number, Order_Date:Order Date, Required_Date:Required Date, Shipped_Date:Shipped Date, Status:Status, Comments:Comments”)
Where, “FindAllShippedOrders” is the connector name, and for the rest of the formula is mapping of variables.
This process is similar to the one we used for finding the motorcycle category in the products list. And you can use a similar approach for the rest of the orders’ status.
Step 2: Yearly Sales Numbers Line Graph

The yearly sales line graph is handy for the admins to understand their market growth. Based on the monthly/annual sales numbers, they can strategize their marketing efforts and plans to the month/year which
contributed the most.
This control is straightforward to use. For this app, I used two quantities: Month and Monthly Sales. The formula to use this control is a simple LOOK() formula.
The working of the formula is such that it compares the chosen year value with the year in the Sheet, and displays the data accordingly.
LOOKUP([Airtable_Yearly_Orders.Month,Airtable_Yearly_Orders.NumberOfOrders],Airtable_Yearly_Orders.Year = chooseyear,Airtable_Yearly_Orders.Month_Number,”ASC”)
Where, “Airtable_Yearly_Orders.Year = chooseyear” is a filter used, and Airtable_Yearly_Orders.Month_Number, “ASC” is the order of display, i.e. Ascending Order, according to the month.
To understand more about how to use a line graph, read more here.
Step 3: Category-wise Products Division Pie Chart 

The admin can view product division, which will help him/her for further decision-making processes like adding new products to the list, which are less in number, and more.
The formula to use this control is a simple LOOKUP() formula:
LOOKUP([Airtable_Product_Types.ProductType,Airtable_Product_Types.Total_Quantity])
To understand more about how to use a pie chart, read more here.
Step 4: Sales Numbers of each SDR Bar Graph

A Sales Manager must know which of his/her team members are performing well and which are not. This feature will help the manager make decisions like giving appraisals to the best SDR and training those who are not doing well.
More additions to this can be using a monthly or yearly filter (similar to step 2) and can view SDRs’ monthly or annual performance.
Giving this holistic view will also help a newly hired executive to understand the picture.
For this app, I used two quantities: The name of the SDR (you can use their employee number or email) and the number of sales done. The formula to use this control is a simple LOOK() formula:
LOOKUP([Airtable_SDR_Sales.SDR_Name,Airtable_SDR_Sales.Number_Of_Sales],””,Airtable_SDR_Sales.SDR_Employee_Number,”ASC”)
To understand more about how to use a bar graph, read more here.
Step 5: Detailed sales view of each SDR using dropdown and table grid control

This part of the dashboard can be of great use for Admins, Sales Managers, and more.
The dropdown menu will allow them to choose an SDR to view his/her performance. Depending on the chosen SDR, the table grid control will display all the orders associated with the particular SDR (in short, it will show the sales done by that sales rep).
Further, clicking on any one order will show a detailed view of the order, like products sold, the quantity of the product, and the price of each.
So even if a newly hired executive is looking through it, he/she will understand the whole picture of the orders, starting from the order date, order status, and if there are any complications in that.
The formula used in the table grid is:
LOOKUP([Airtable_Customers.CustomerNumber,Airtable_Customers.CompanyName,Airtable_Customers.FirstName,Airtable_Customers.LastName,Airtable_Customers.Country] , Airtable_Customers.SalesRepEmployeeNumber = chooseansdr , Airtable_Customers.CustomerNumber , “ASC”)
Where, “Airtable_Customers.SalesRepEmployeeNumber = chooseansdr” is a filter used, “chooseansdr” is the unique name of the dropdown, and Airtable_Customers.CustomerNumber, “ASC” is the order of display, i.e. Ascending Order, according to the month.
The custom internal tools you build in DronaHQ can be configured so that you can do much more with your Airtable data. In the Airtable admin panel we just built, you can also –
- Integrate the tool with other services like Stripe for payment management, or Gmail to send out transaction update emails or send invoices
- Only grant access to specific users or roles. Say you only want the managers to see this admin tool and have edit rights.
- Set up multiple views for the Airtable data
- Update order status. Add, update, or delete Products
- Use a a form to add new arrivals of the products, something like managing the product/stock inventory
- Add discounts or other promotional offers to the products
and so much more.
Originally published at Medium.

Related Articles