Build dashboards without the frontend hassle
Ship internal dashboards 10× faster. Just type what you need, and let AI generate functional screens with charts, tables, and live data.


From startups to Fortune 500s, the world’s leading teams rely on DronaHQ to build dashboards.
Going with DronaHQ was an easy decision. It is helping us cut down the time to launch admin dashboards from a few weeks to a few days. Support for unlimited end-users was cherry on top.”
Build production-ready dashboards with AI
Start with a prompt or drag and drop from over 150+ pre-built UI components like charts, graphs, tables, lists, and dashboards. Using a flexible JSON layout editor, build basic charts, statistical charts, financial charts, scientific charts, maps and more.
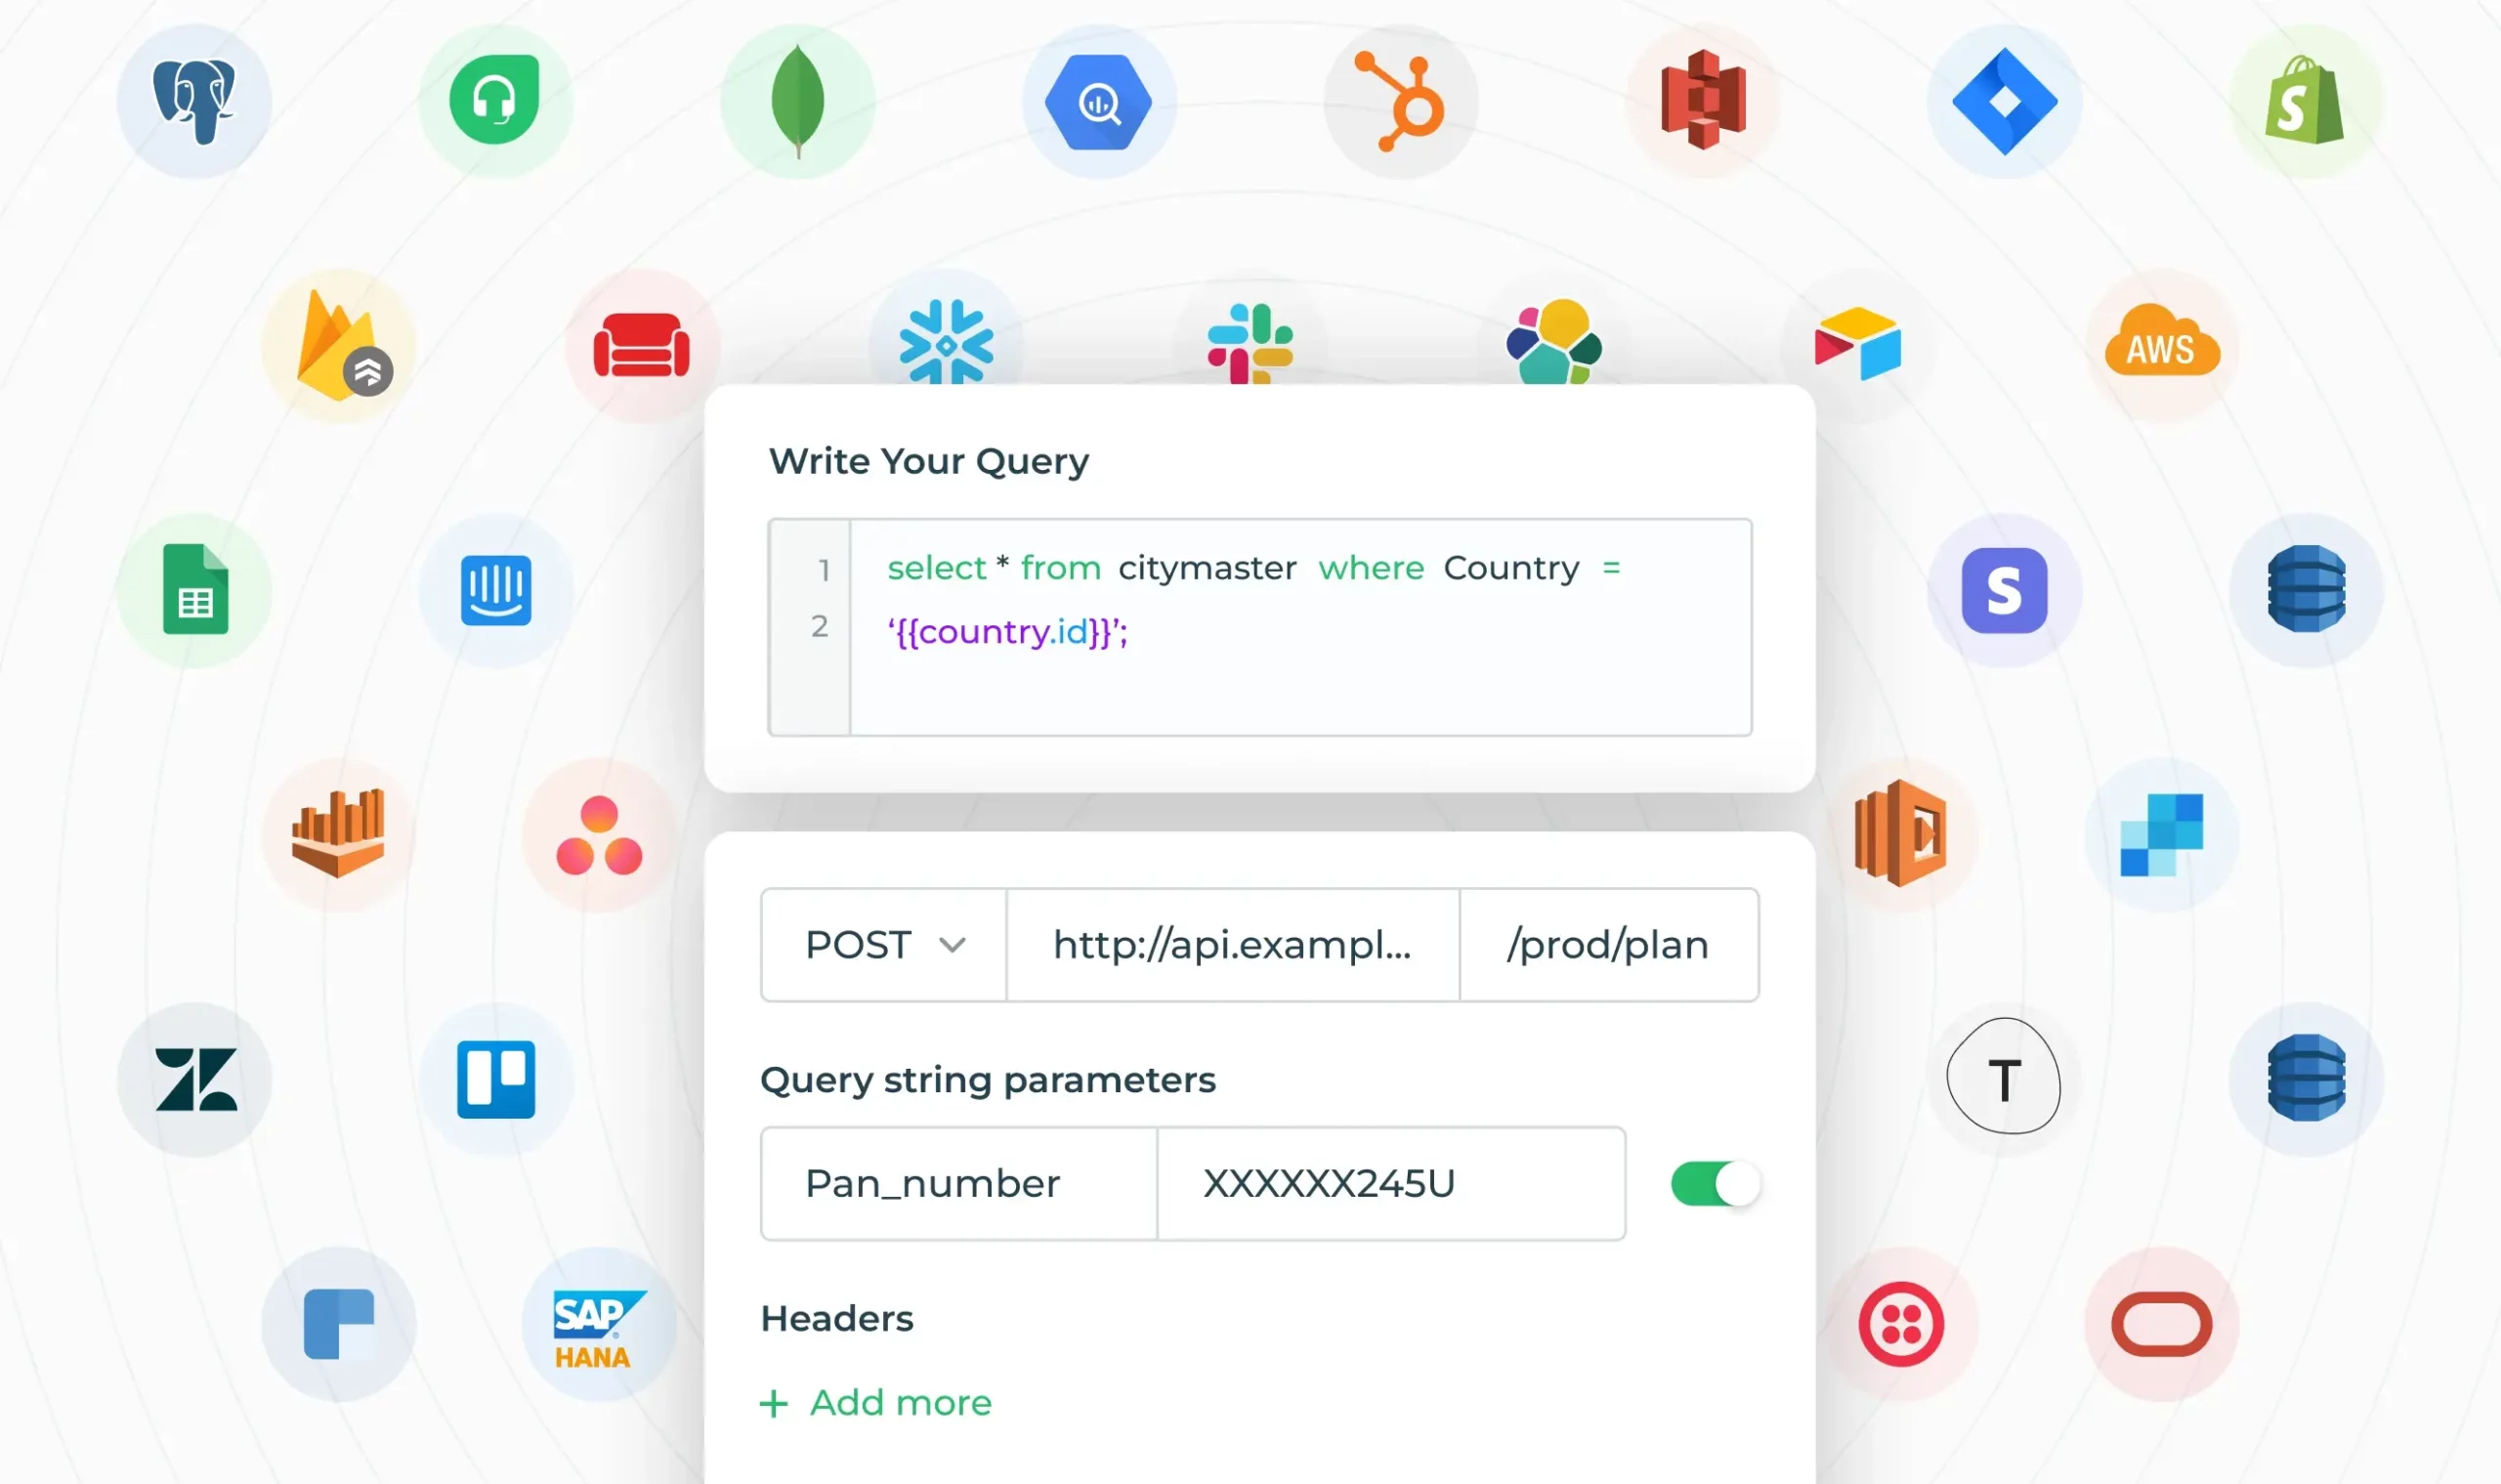
Connect REST, SQL, GraphQL, LLMs
Integrate admin dashboards to external databases, APIs, or LLMs using 70+ native connectors or use DronaHQ’s managed database.
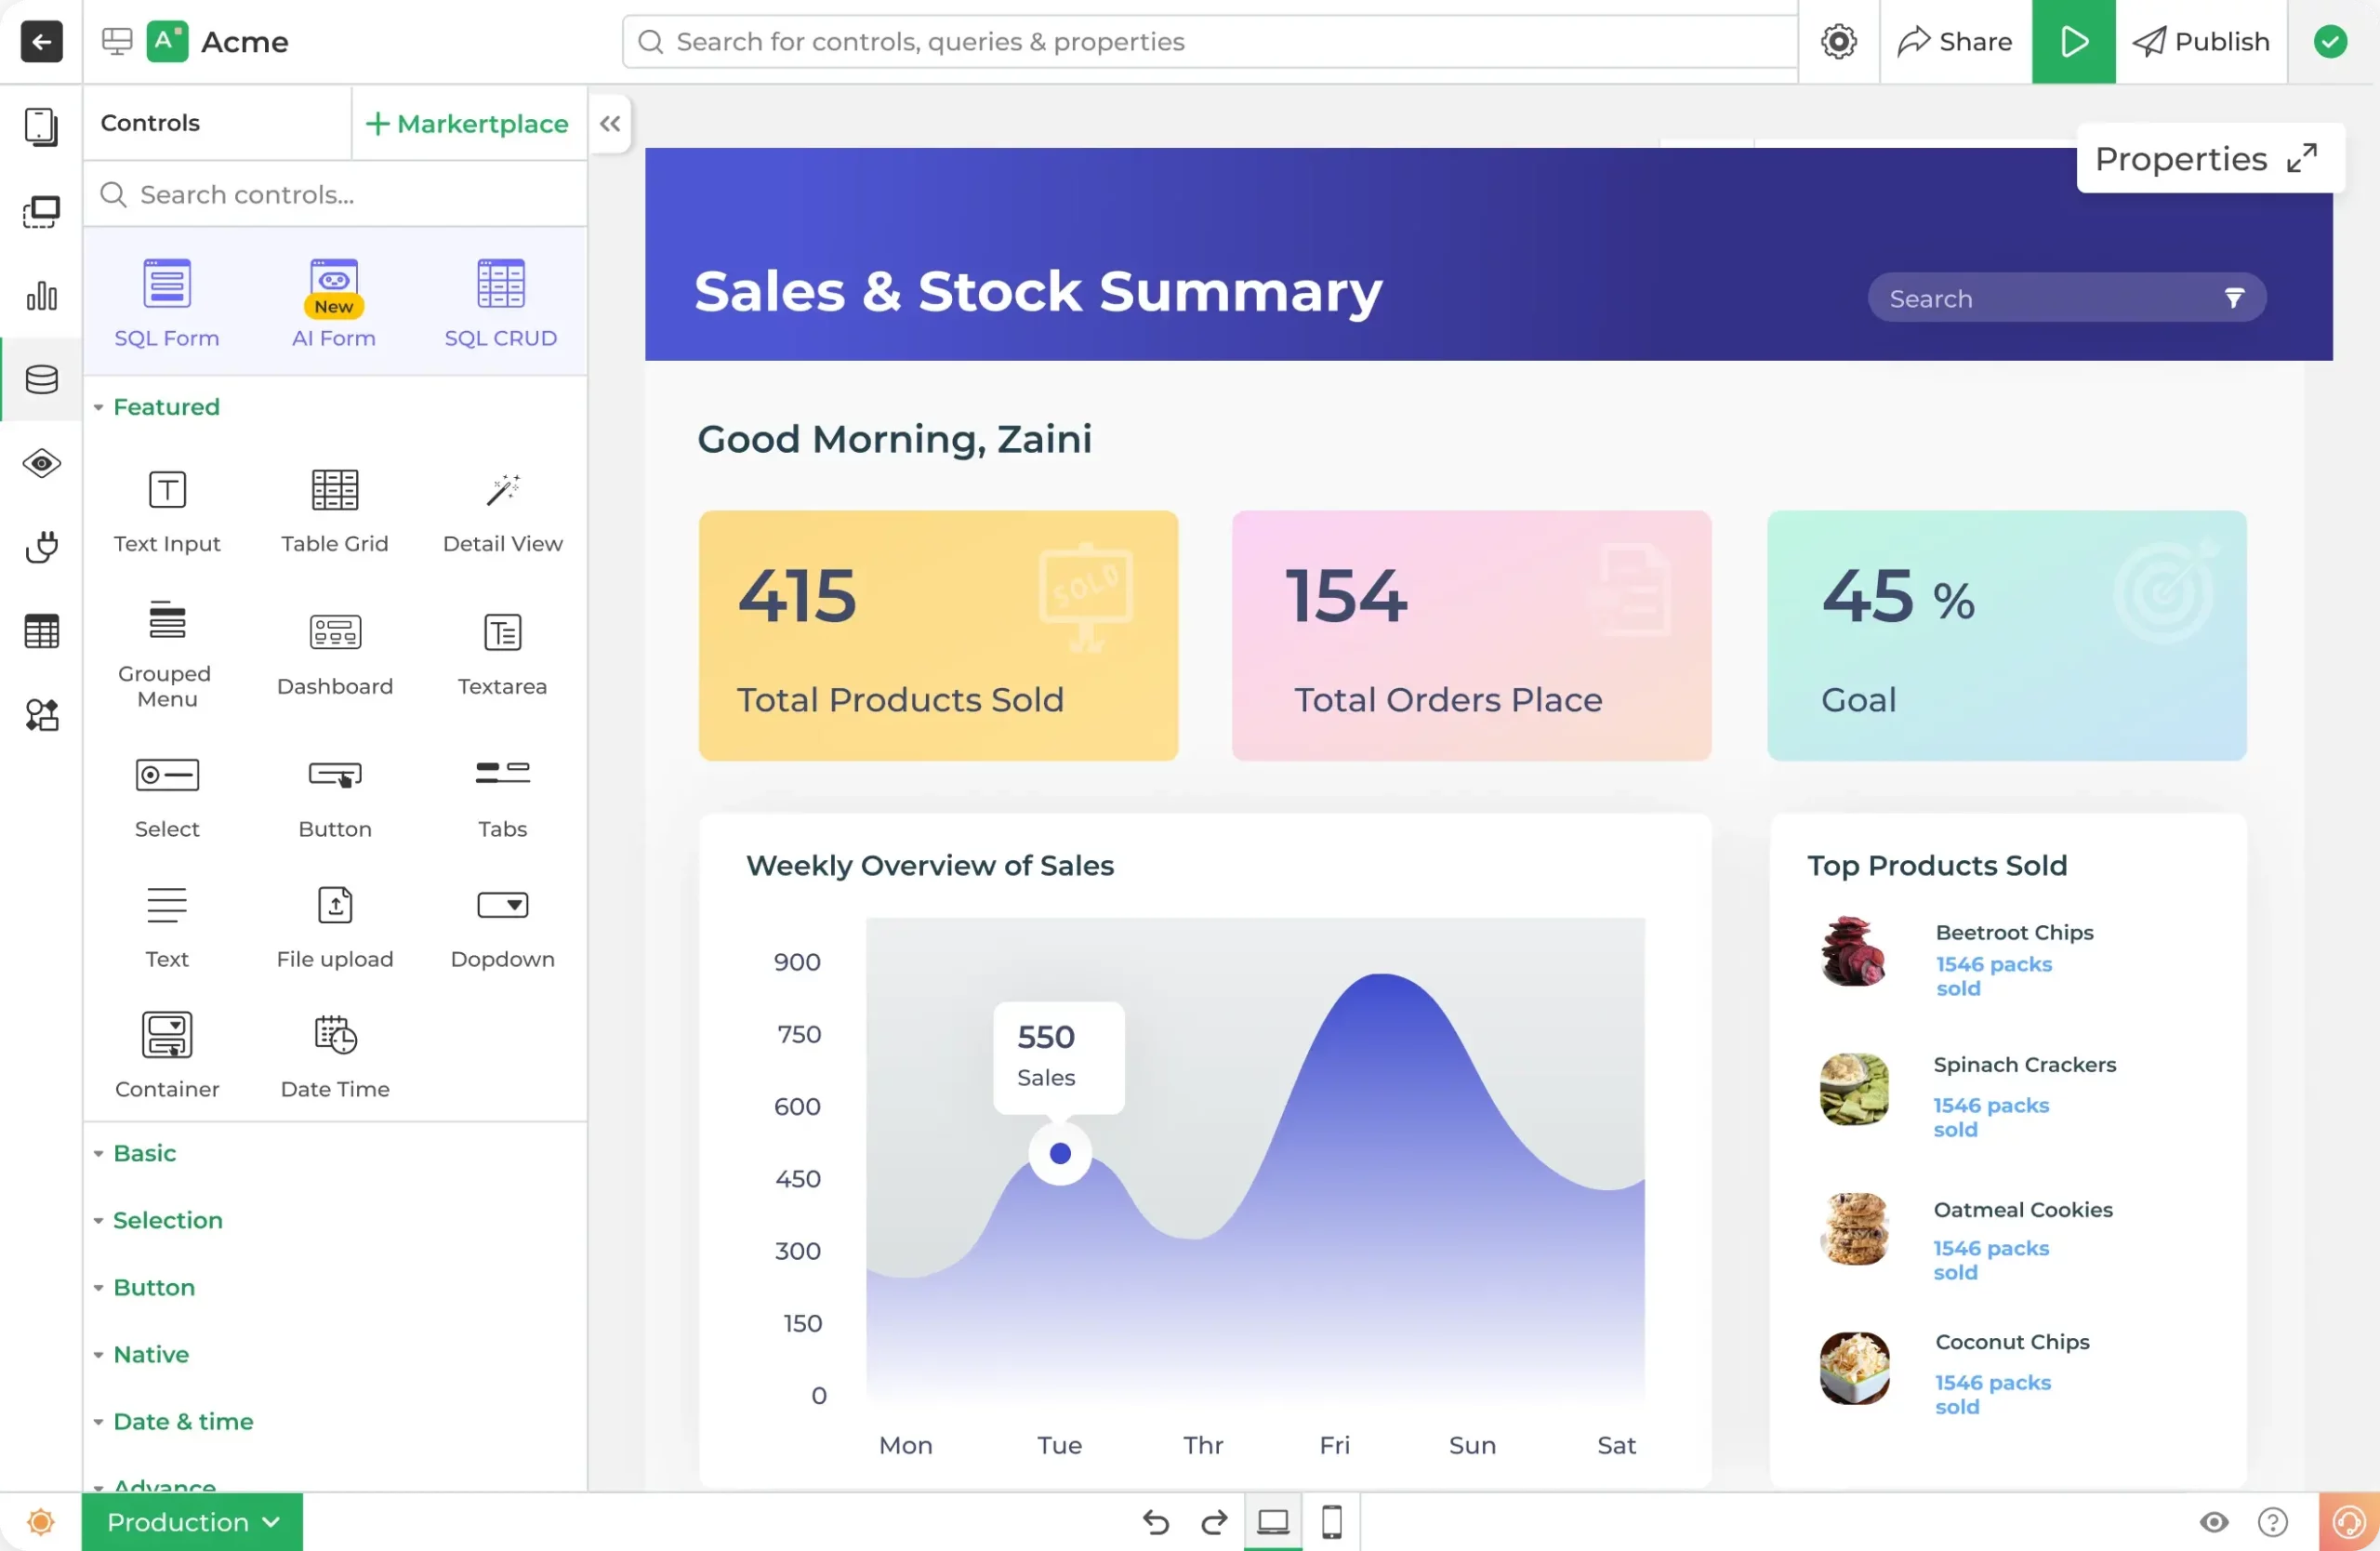
Easy-to-use dashboard builder with ready charts, graphs and tables
Build dashboards that actually work; search, update, filter, trigger events, all visually, or with AI-assist.


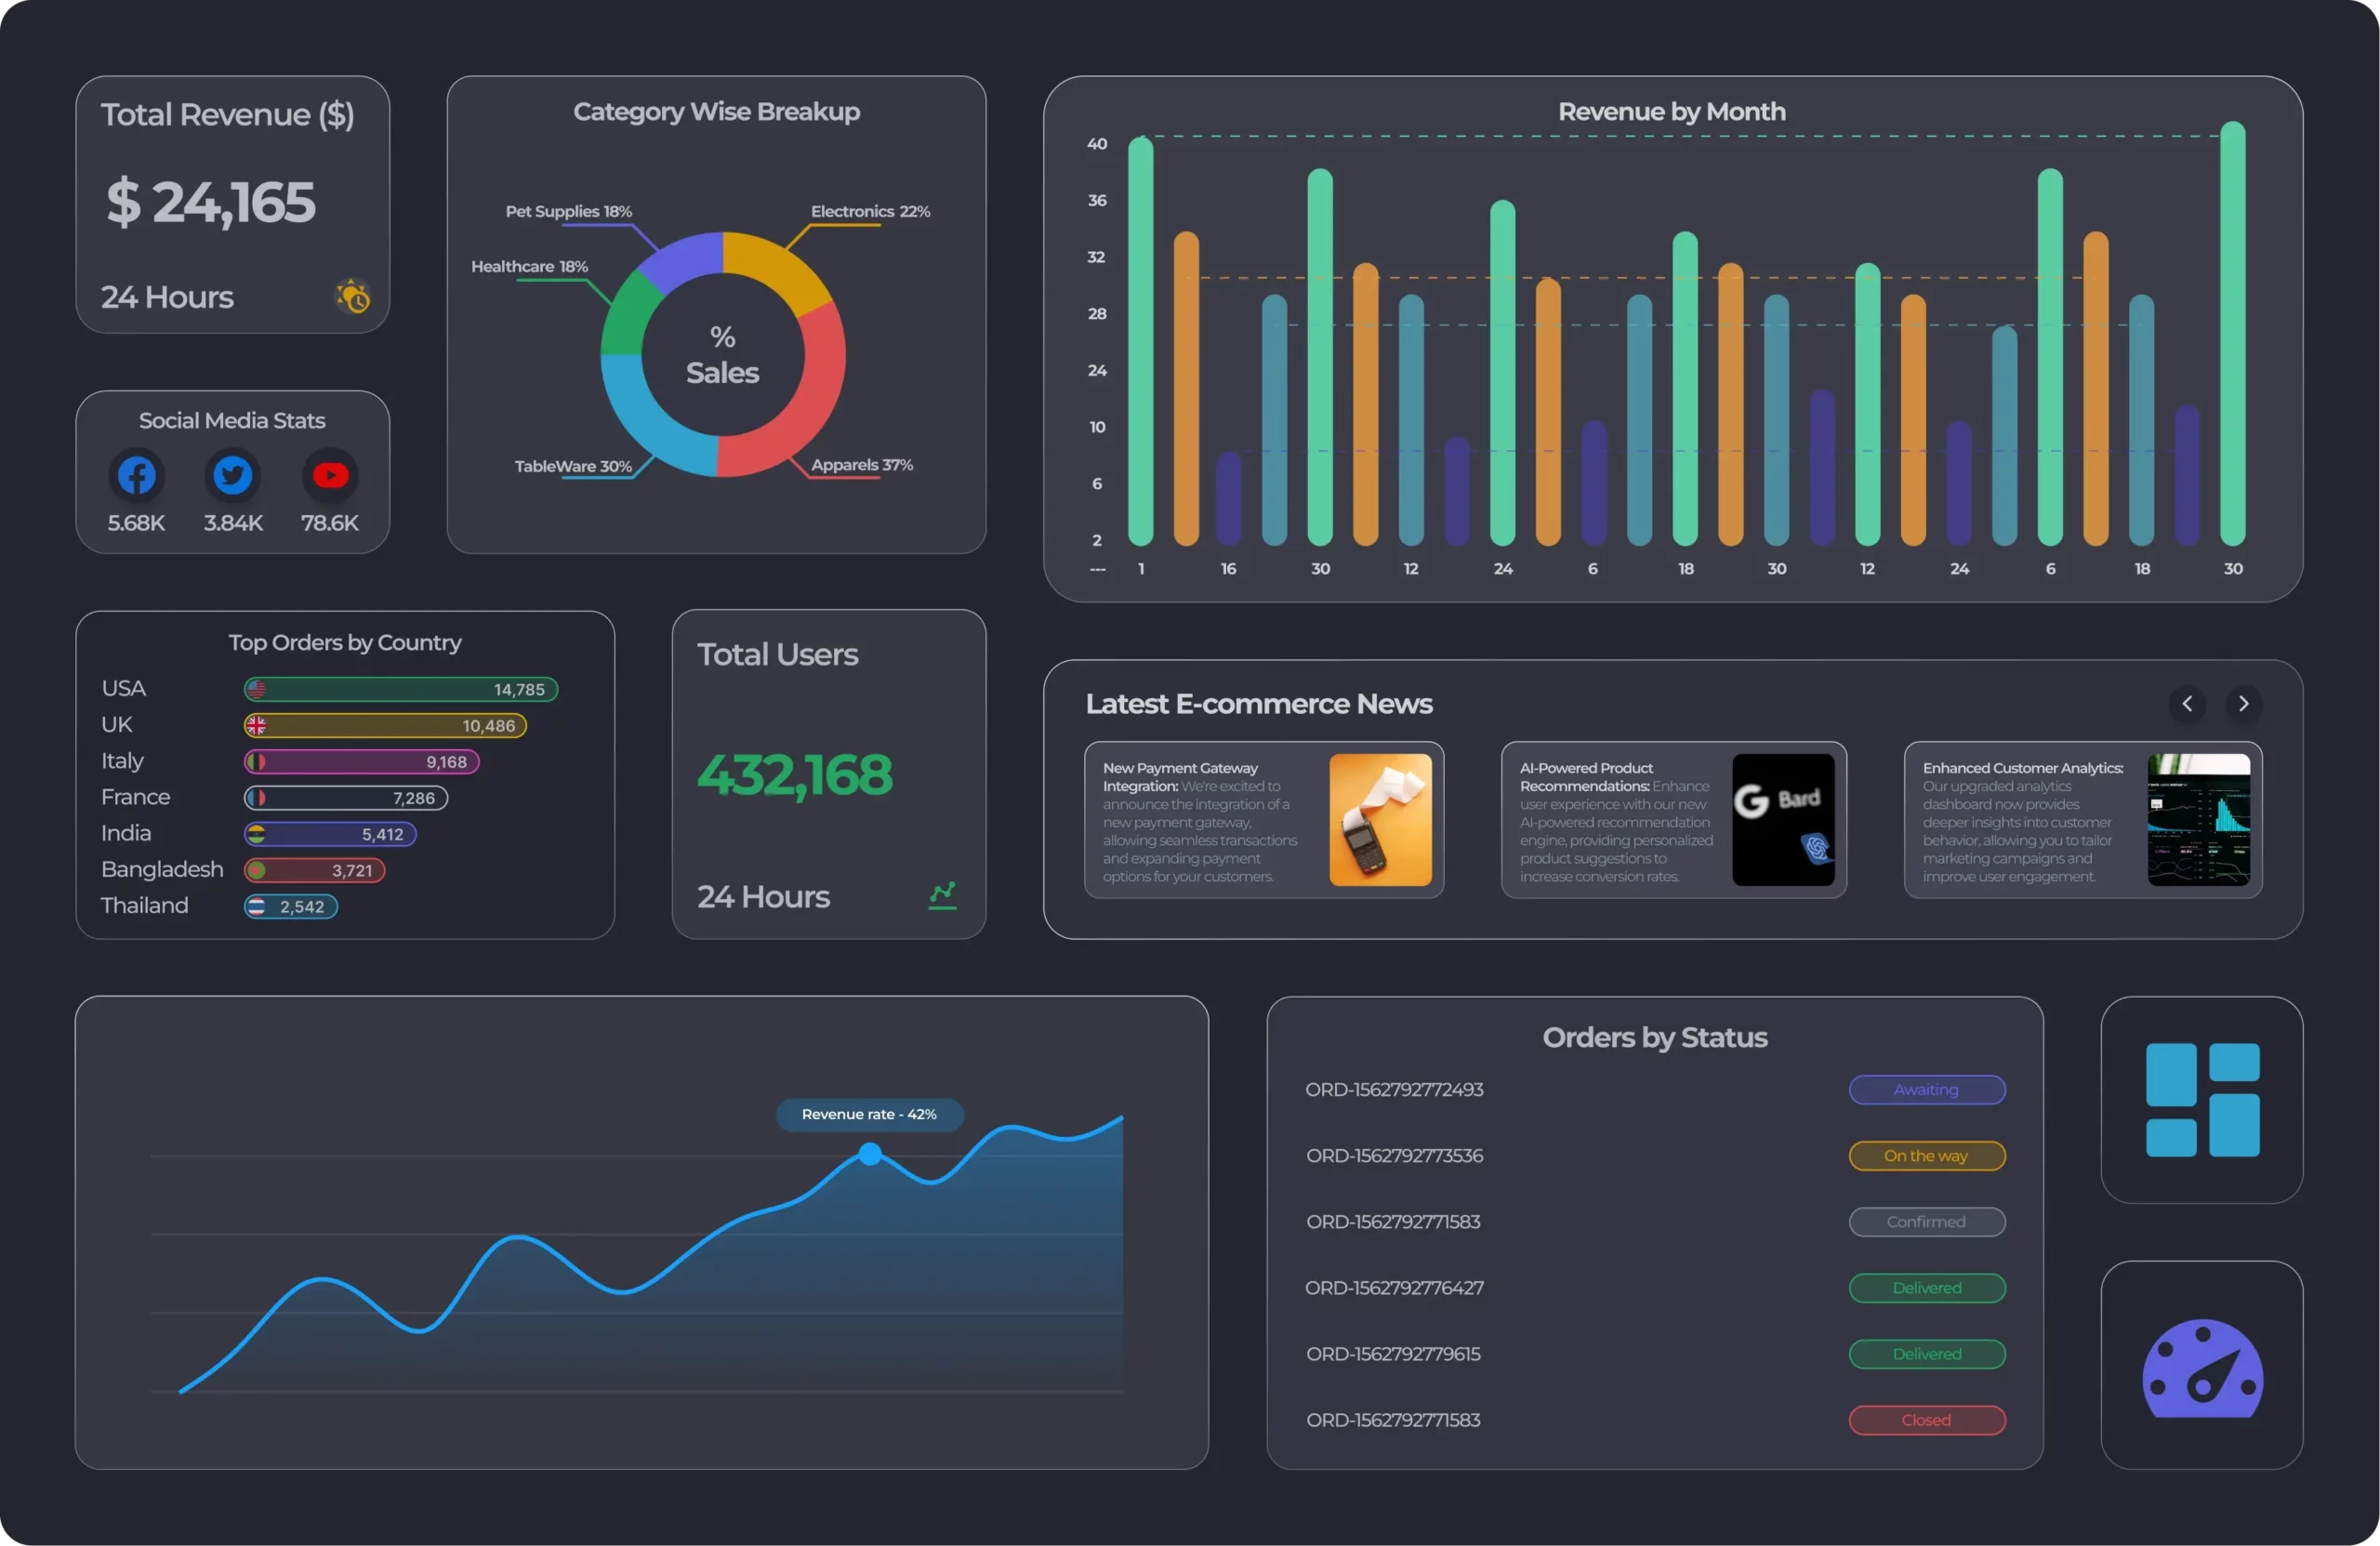
Popular dashboard designs to track KPIs and manage projects
With DronaHQ's intuitive dashboard builder, creating tools for data visualization is as easy as connecting your data sources and choosing the right UI components to create your dashboards.


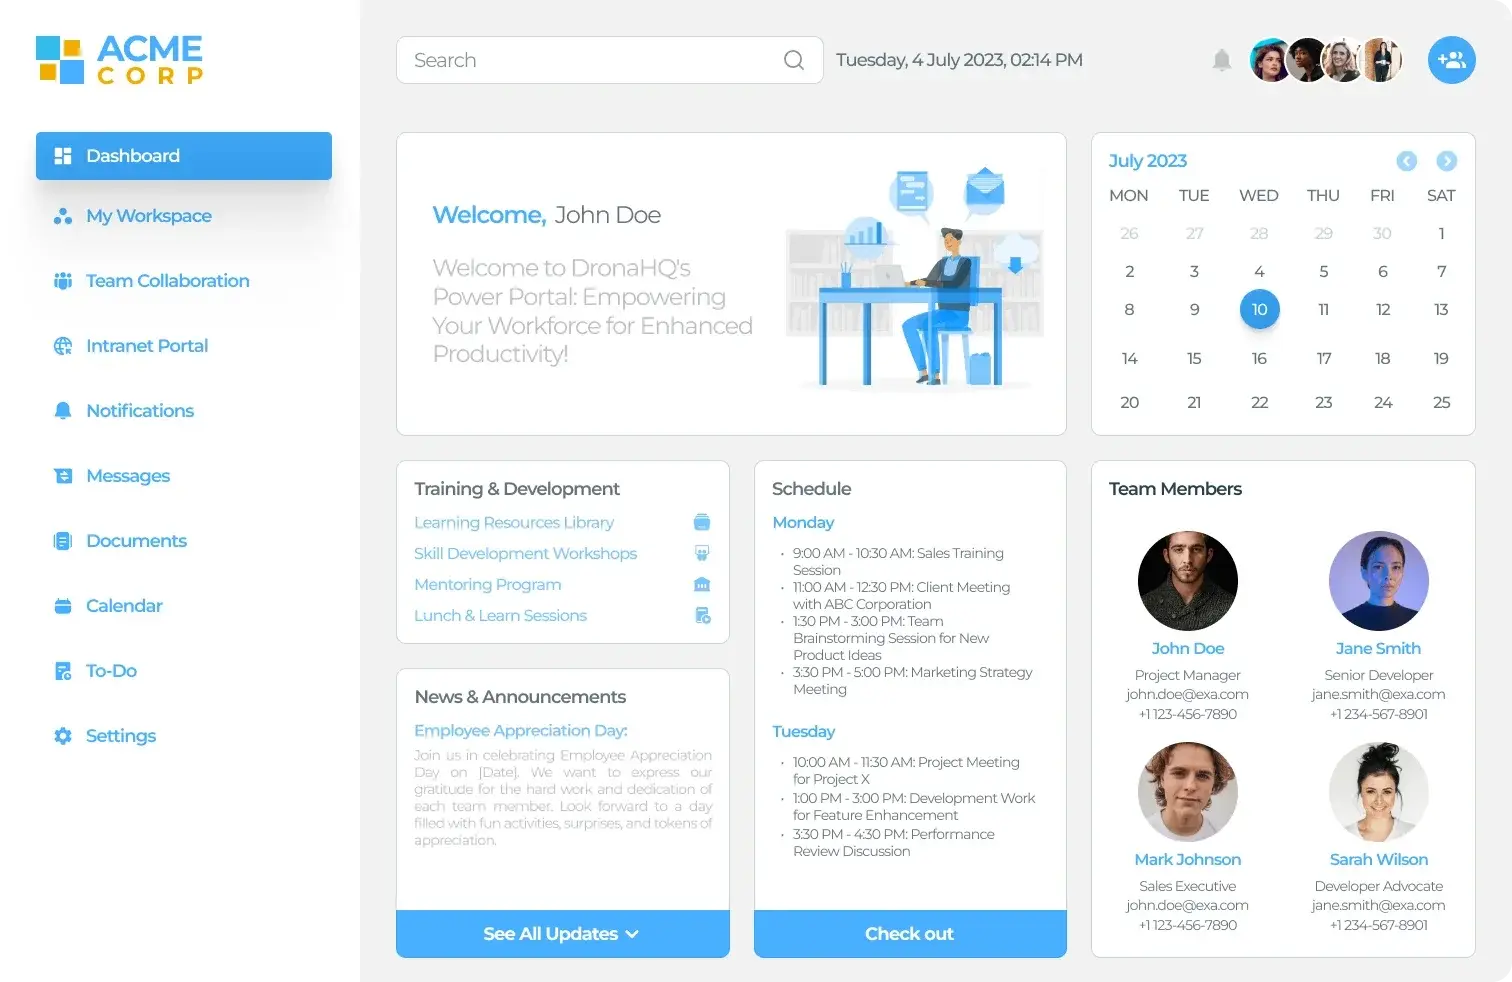
Build interactive dashboards with AI dashboard builder
Create an account instantly, connect your data sources and build apps. Use AI builder to get your dashboard ready in minutes.

Book a demo
Schedule a 1:1 session with an expert from our team.

Multiple pricing plans
Comprehensive and transparent pricing with no hidden fees.