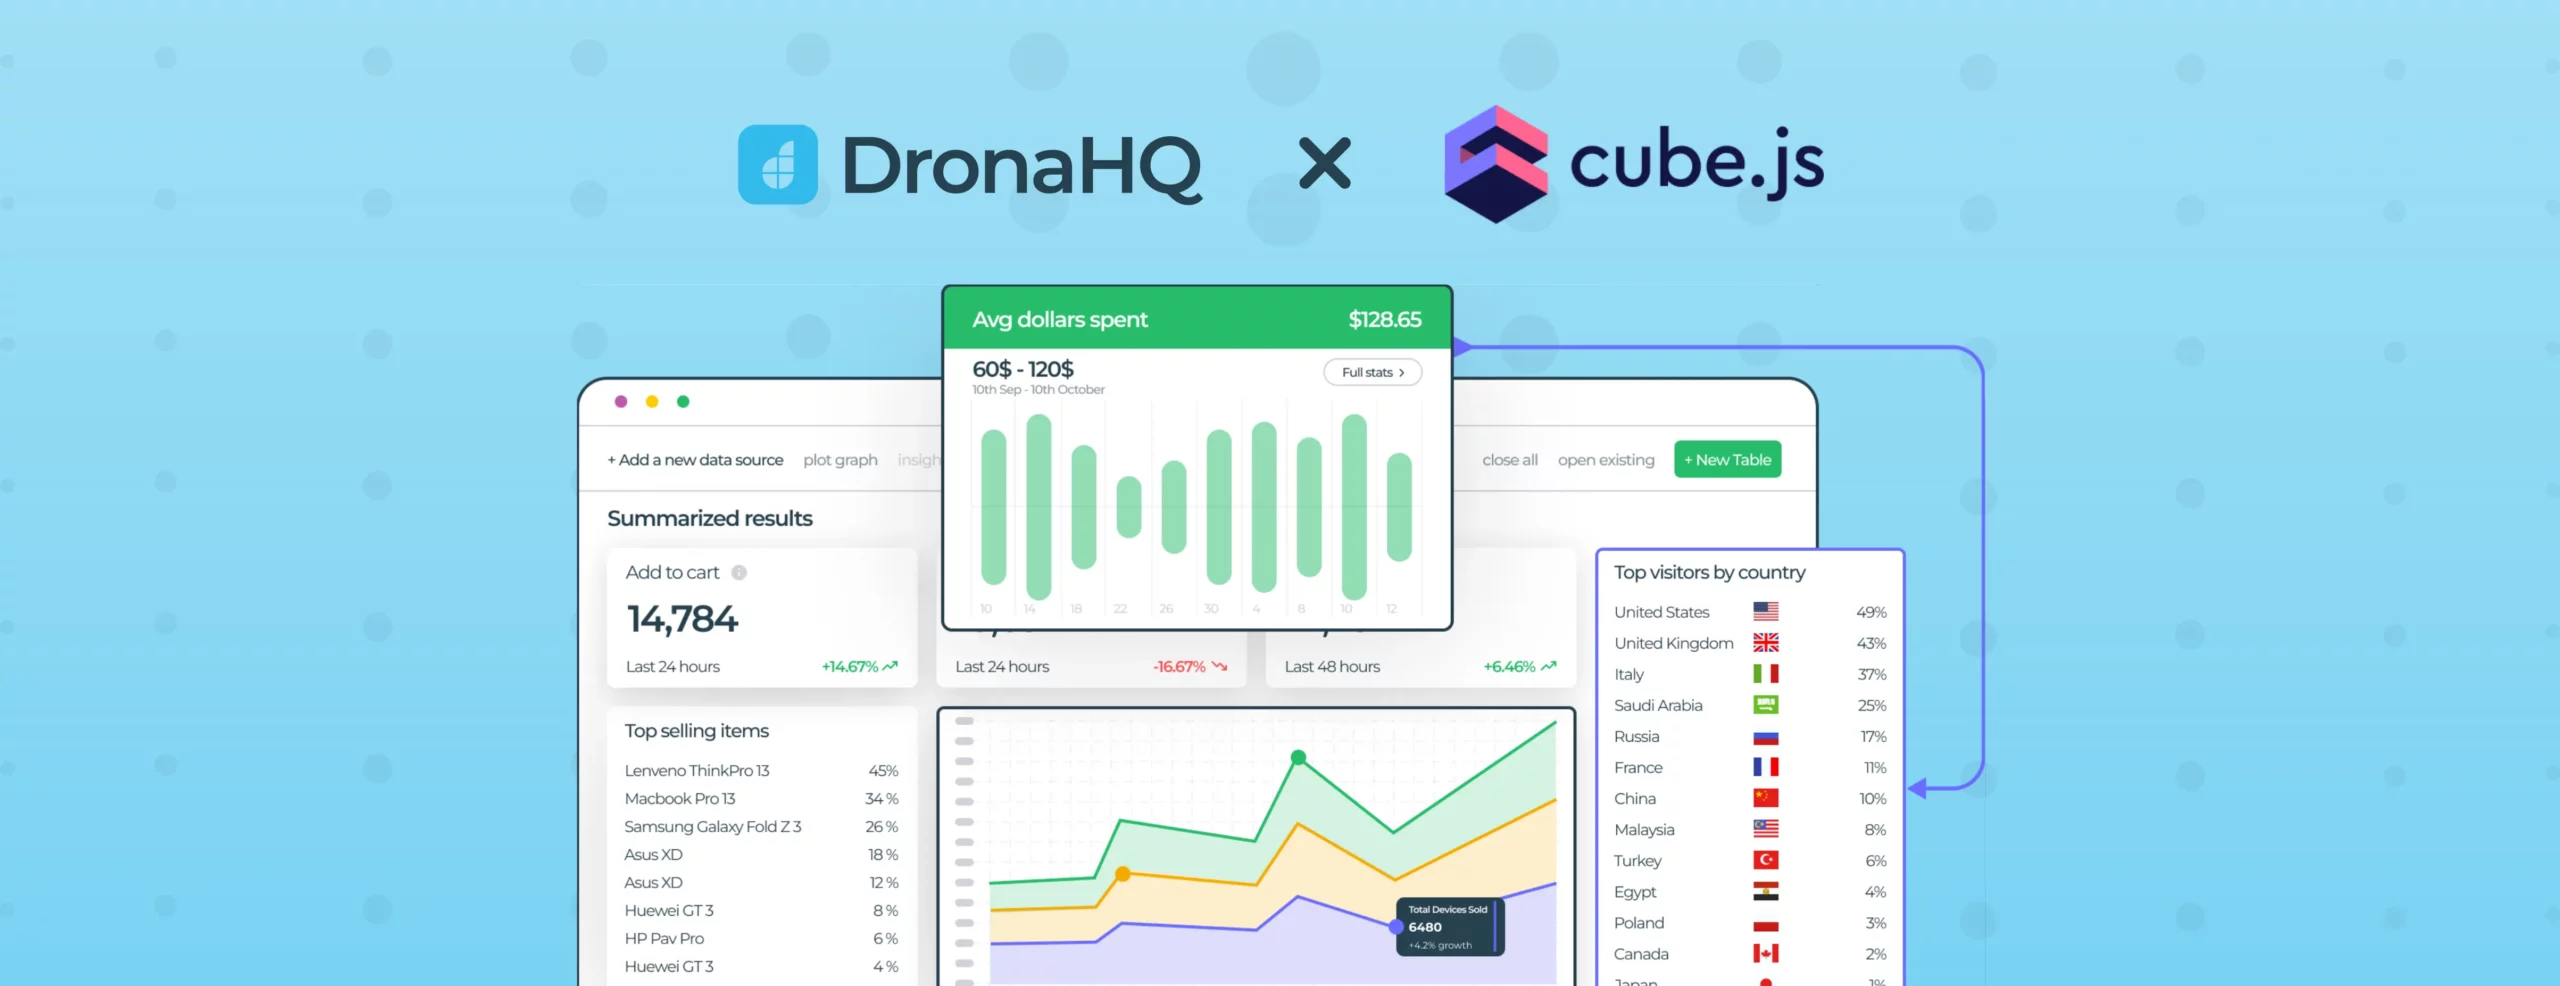

Building Internal Dashboard on DronaHQ using Cube
In this tutorial, we will demonstrate how to build an internal dashboard on DronaHQ using Cube. Cube is a cloud-based platform that allows you to connect to various databases and perform analytics on your data. By integrating Cube with DronaHQ, you can leverage the power of Cube’s data processing capabilities to create insightful visualizations and interactive dashboards for your organization.
Prerequisites
Before we begin, make sure you have the following:
1. DronaHQ account: Sign up for a DronaHQ account if you haven’t already.
2. Cube account: Create a Cube account to access its cloud facility.
3. Sample PostgreSQL data: We will use sample PostgreSQL data for this tutorial. Cube supports a wide range of databases, so you can choose the one you are comfortable with.
Setup of the Tools
To get started, follow these steps:
Cube Setup
Sign in to your Cube account and access its cloud facility. Connect to your desired database. For this tutorial, we will use PostgreSQL.
Setting up Database in Cube
We must have a Cube account to access its cloud facility. I need to connect to the database. For this I will be using sample PostgreSQL data.
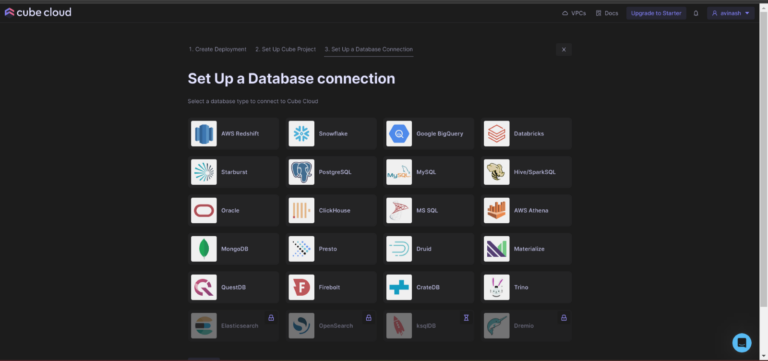
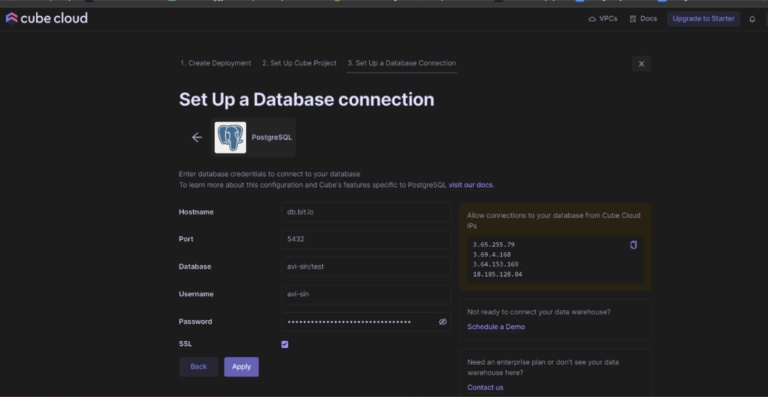
I selected PostgreSQL from the list of database options. You can find support of dozens of databases in Cube, you can select from any database you are comfortable with.
Now to connect, I need to add a few details ‘such as Hostname, port, username and more to form a successful connection.
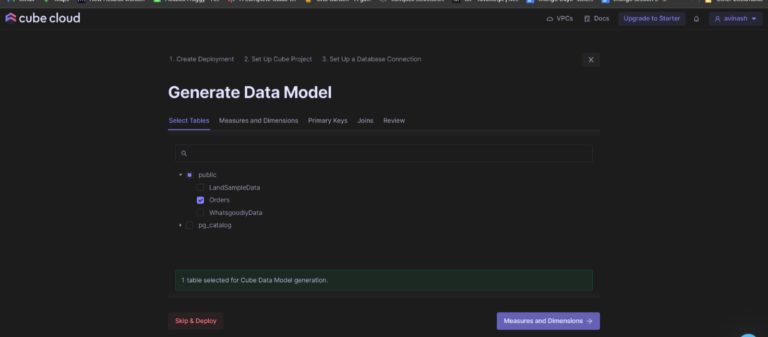
In the next step, I need to feed the data to Cube by selecting the correct schema from the desired table under the Generate Data Model. This will help in building a schema for my table (database) dedicatedly for Cube.
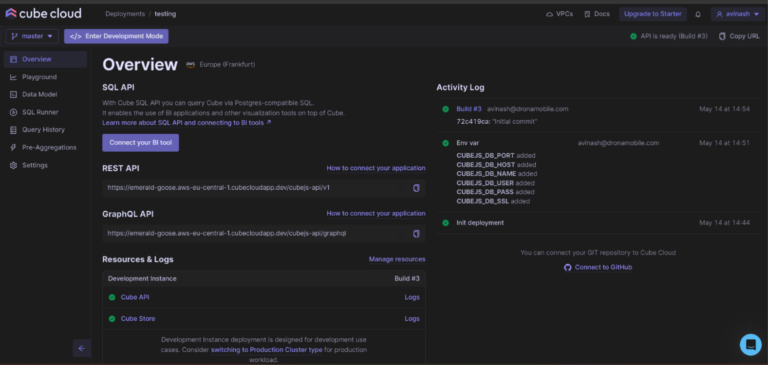
The Cube cluster is ready and can be accessed properly. The completion can be checked from the overview window.
DronaHQ Setup
1. Login to your DronaHQ account. Don’t have an account yet.
2. Create a new blank app where we will work on the layout of the dashboard.
Integrating Cube with DronaHQ
In this section, we will walk you through the technical steps involved in integrating Cube with DronaHQ.
After we have set up the database in Cube, we have to integrate Cube queries from our DronaHQ App after successfully configuring Cube REST API in DronaHQ Connectors.
Let’s start by creating a blank app in DronaHQ. Here we will work on the layout of the dashboard.
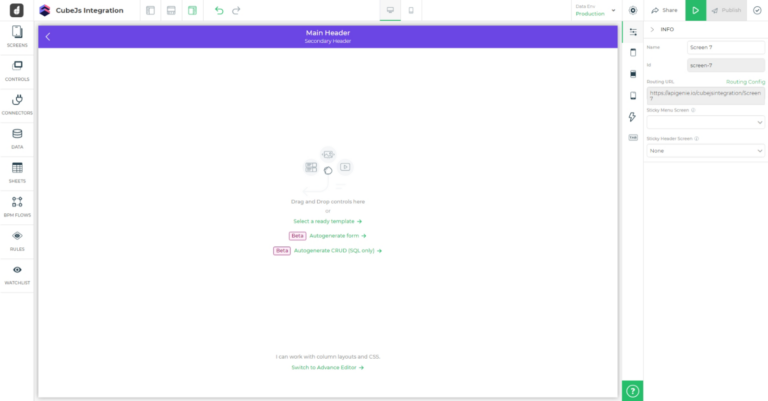
The template building for the dashboard will be continued later, after we set up a connection with the Cube Cloud database.
Configuring REST API – Cube
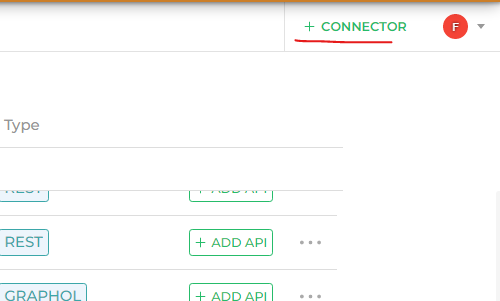
Go to the connectors in the Studio platform. Click to add a connector.
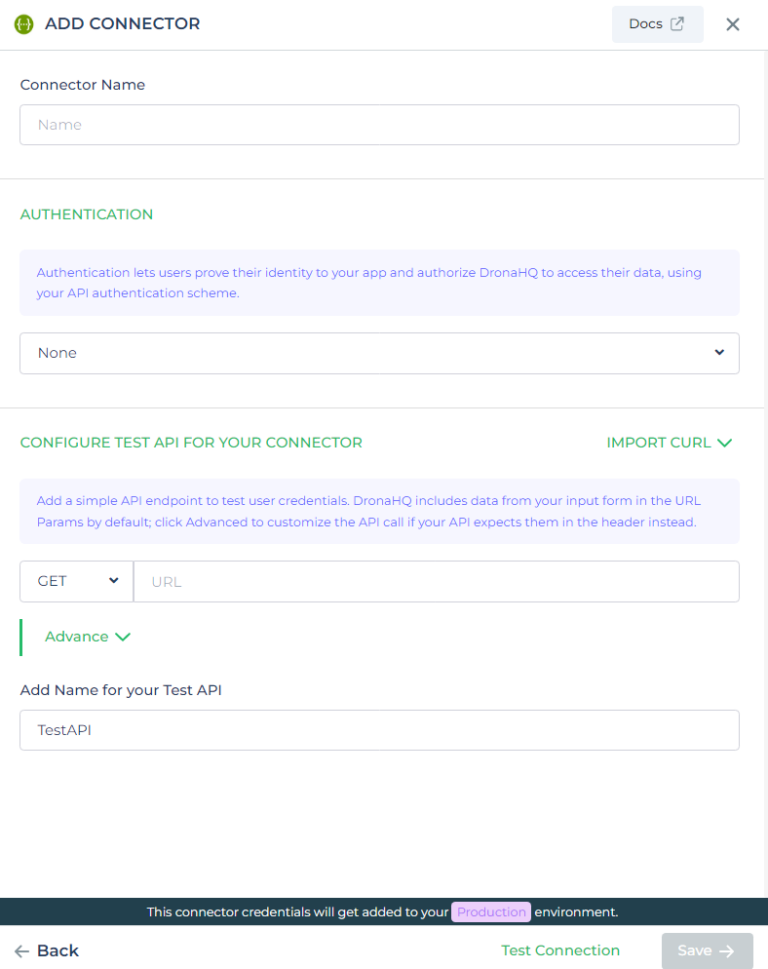
Under the APIs select `REST API` connector. You will find that a REST API configuration window has opened. This we must fill as per the configuration details available in my Cube account.
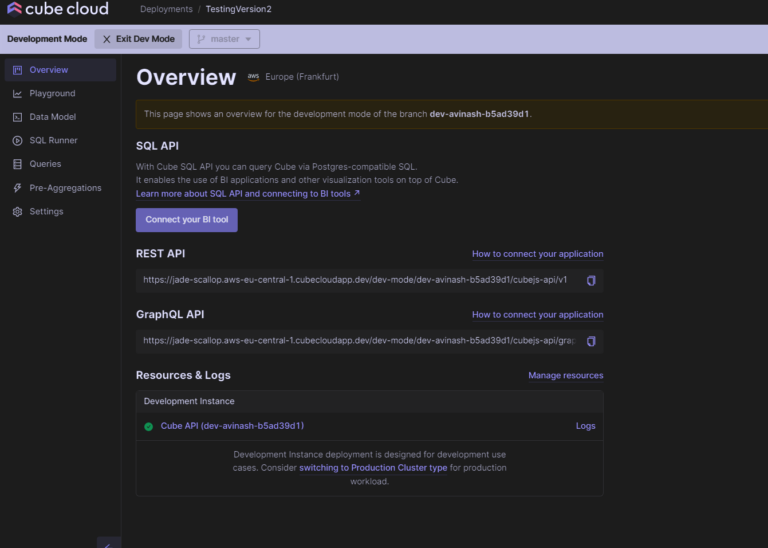
To configure the DronaHQ REST API connector with my Cube Cloud deployment, simply I will go to the overview window of Cube and click on `How to connect`.
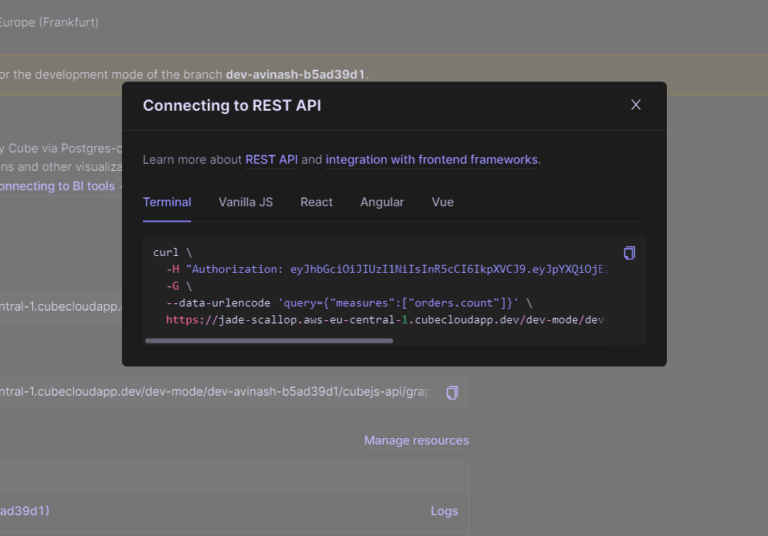
`curl \
-H “Authorization: eyJhbGciOiJIUzI1NiIsInR5cCI6IkpXVCJ9.eyJpYXQiOjE2ODM3OTYyNTB9.8n-ebOh8z4bnh5SW4oKLeheCDx3DOqs7yM-dCI66Xbw” \
-G \
–data-urlencode ‘query={“measures”:[“orders.count”]}’ \
As you can see above, I got a cURL connection. Now either I can just copy the cURL connection string and paste it under the DronaHQ Import CURL feature – This will fetch all the details and auto-fill the required sections such as API keys, authorization, query and more – Or I can copy and paste all the required fields separately from Cube to DronaHQ connector configuration tab.
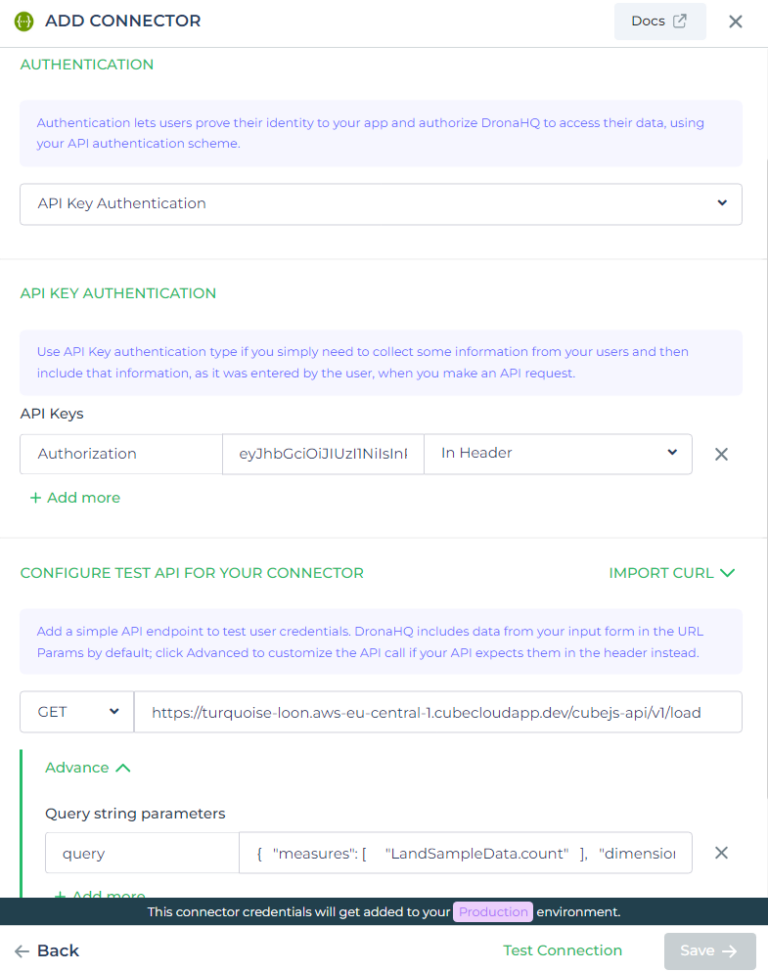
The /load part of the URL as it’s an API path, not part of the base URL. The /load part is used to create and send queries. This is what I am using to create the DronaHQ Query for fetching data from Cube.
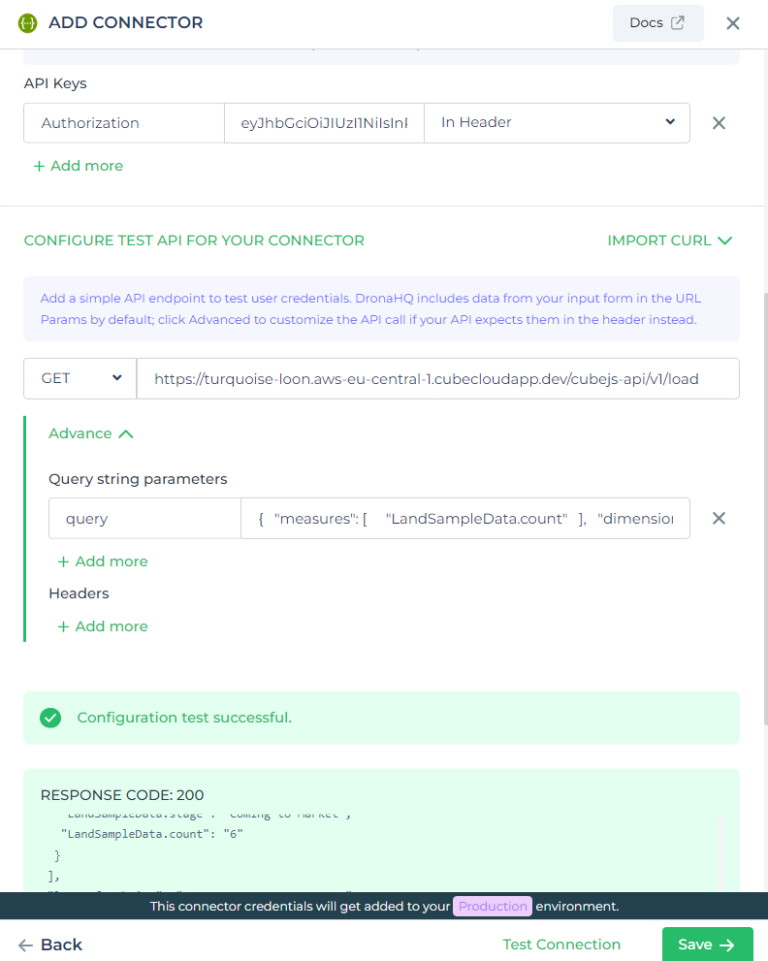
Do the test connection and hit save after a successful response.
Writing queries on DronaHQ for Cube
We have our resource ready to use from Cube REST API connector. Now I will focus on writing a query to fetch the data from the Cube Cloud.
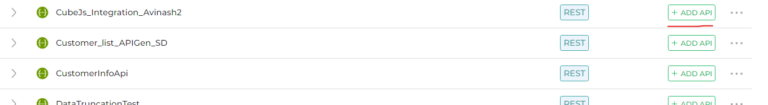
Find the configured connector from the connector list and click `+ ADD API`.
After giving the name to the query, I will check if the API method is set to `GET` since I want to fetch the data from the database of Cube Cloud.
I will now mention the API path, which is – `/cubejs-api/v1/load`
For the `load`, I have mentioned earlier that this is for sending queries in the API request. So I am going to use the same query from above and paste it as query string parameters.
{
“measures”: [ “orders.count” ],
“order”: { “orders.count”: “desc” },
“dimensions”: [ “orders.ship_mode” ]
}
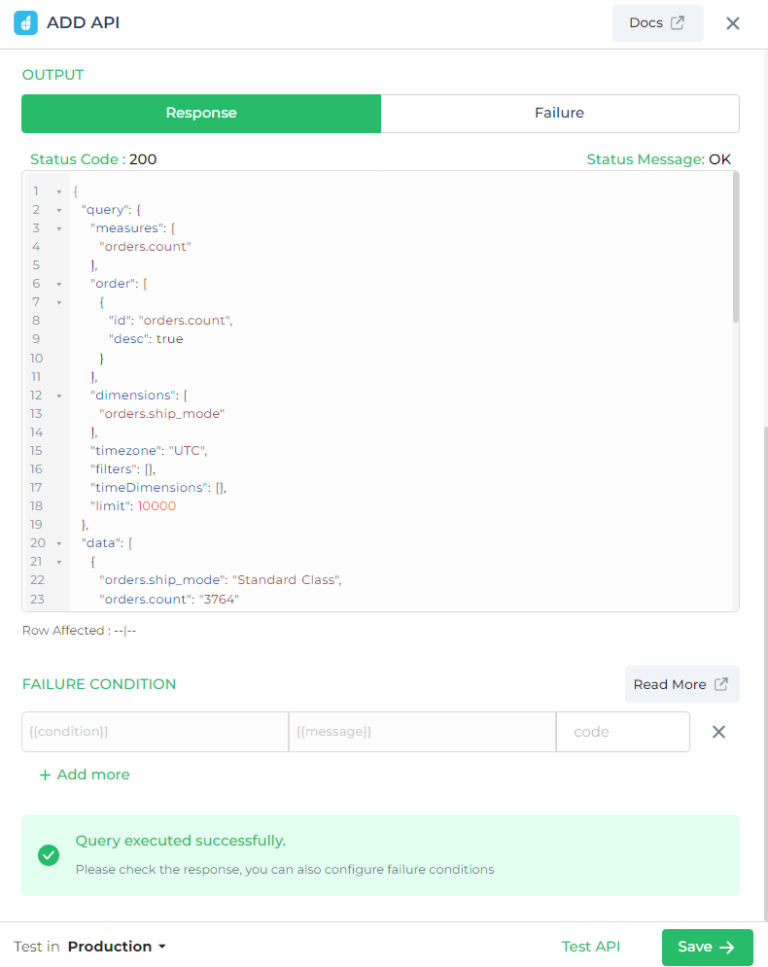
The query builder will look something like this:
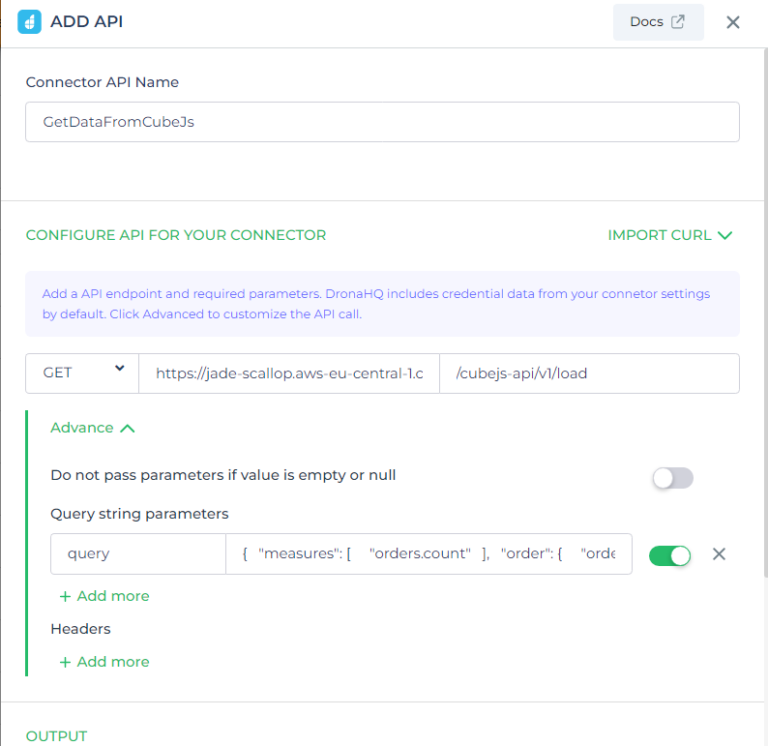
Click on Test API and Save it after a successful response.
Creating the Low-Code Dashboard with Charts and Graphs
Now that I am done with the backend database connection and queries, it is time to build the UI for our dashboard with illustrative charts and graphs by simple drag and drop method.
DronaHQ allows you to drag and drop UI components into the app builder, making it easy for me to place charts and other controls.
The UI for the dashboard I am choosing, will look something like this:
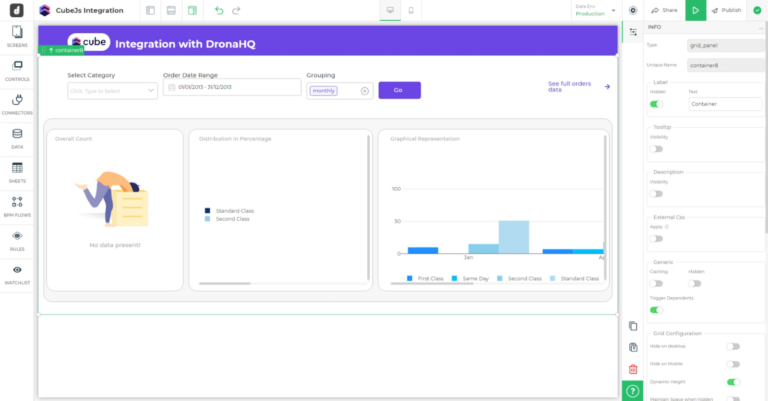
If you look closely, we have various control components which I will be using to perform grouping and sorting on the data being fetched from the Cube Database.

So we have filtering options based on the type of data and range of data, along with grouping based on monthly and quarterly.
Reflecting Dynamic Values on Charts and Graphs
The final task of this whole dashboard is to fetch data and populate it on graphs and charts. How to do this? Well, I will be using action builder to process all the inputs from the user, send the request and fetch the data. Later on, use the data on different illustrative components. All of these will occur, on a single click of a button.
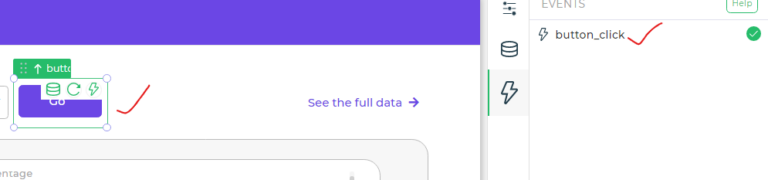
Select the button, go to its events and select `button_click`.
Before moving ahead, I want to put focus that, this action builder will help us performing some of the major tasks, such as:
- Building a query from the provided user inputs.
- Use the query from above to send an API request, and fetch the data based on the query.
- Group the fetched data, add attributes and details using JS code block and finally set the component values of graphs and charts.
We will now see how I am executing all the tasks one by one using the action builder.
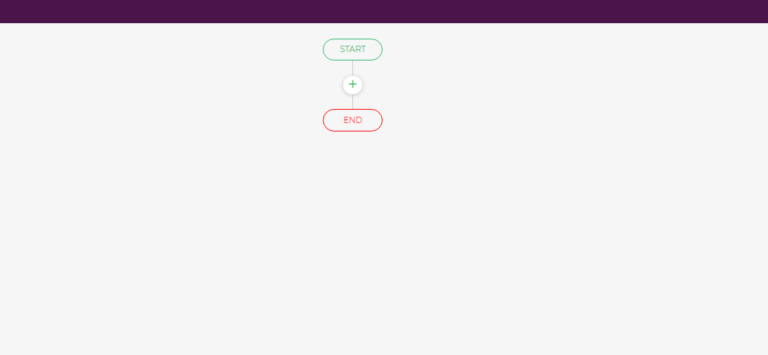
Making Query for Cube API from User Inputs
Add an on-screen action of JS CODE. This will have input parameters from our micro app, whole values will be equivalent to the sorting, grouping and ranging components I have added.
I have added the input parameters from my app with added test values.
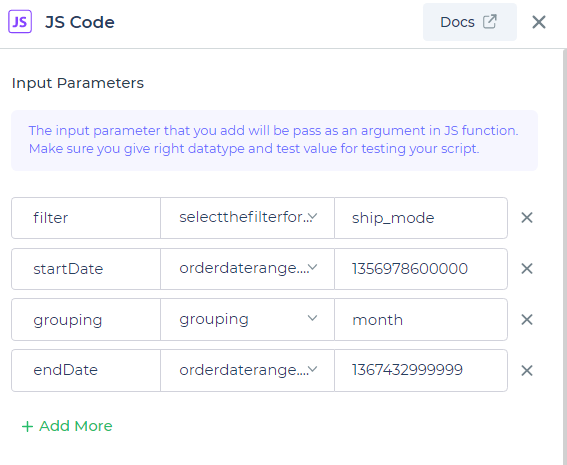
The input parameter that you add will be passed as an argument in the JS function. Make sure you give the right data type and test value for testing your script.
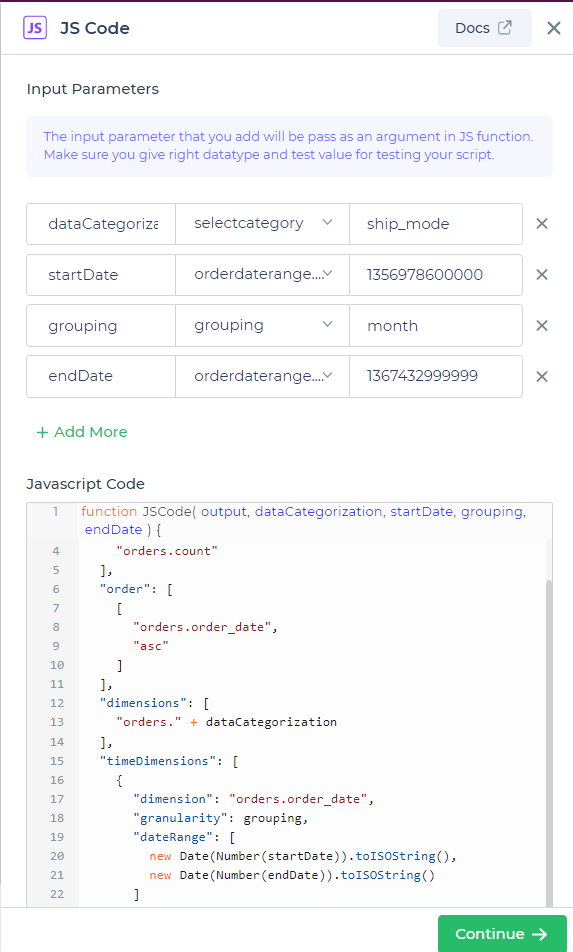
Next part is to write the JavaScript code. While writing the JS Code, I will make sure to include all the input parameters as variables and shape it in the format of the query that I have passed earlier while configuring the API to fetch the data.
CODE:
output = {
“measures”: [
“orders.count”
],
“order”: {
“orders.order_date”: “asc”
},
“dimensions”: [
“orders.” + filter
],
“timeDimensions”: [
{
“dimension”: “orders.order_date”,
“granularity”: grouping,
“dateRange”: [
new Date(startDate/1000 * 1000).toISOString(),
new Date(endDate/1000 * 1000).toISOString()
]
}
]
};
output = {
“measures”: [
“orders.count”
],
“order”: [
[
“orders.order_date”,
“asc”
]
],
“dimensions”: [
“orders.” + dataCategorization
],
“timeDimensions”: [
{
“dimension”: “orders.order_date”,
“granularity”: grouping,
“dateRange”: [
new Date(Number(startDate)).toISOString(),
new Date(Number(endDate)).toISOString()
]
}
]
};
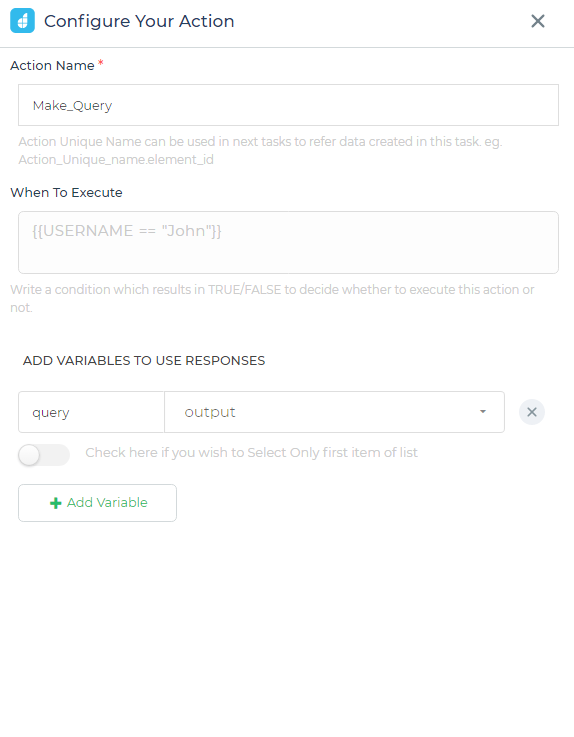
Click Continue and save the output in a variable. This output I will use in sending the API request.
Send API request to Cube to Fetch Data
Now I will add a server-side action of our configured Cube connector with a fetch data query. It will ask me to pass a query and here I will use the keyword
` {{Make_Query.query}}`
To pass the output from the previous JS CODE where we have created the query from the user inputs.
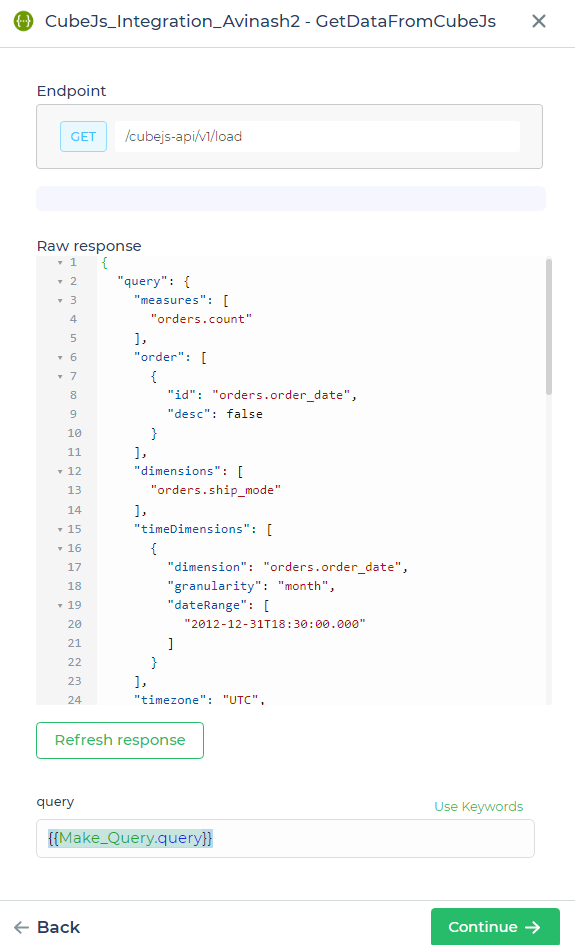
Now click Continue and will save the fetched data in a different output variable.
Grouping the Fetched data from Cube and Setting the values in DronaHQ
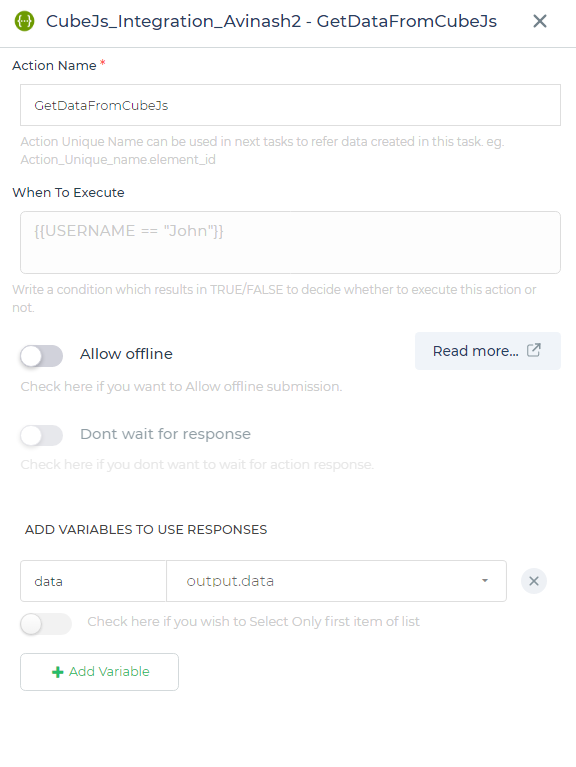
After a successful API call, I will add a JS CODE client-side action to filter and group the data.
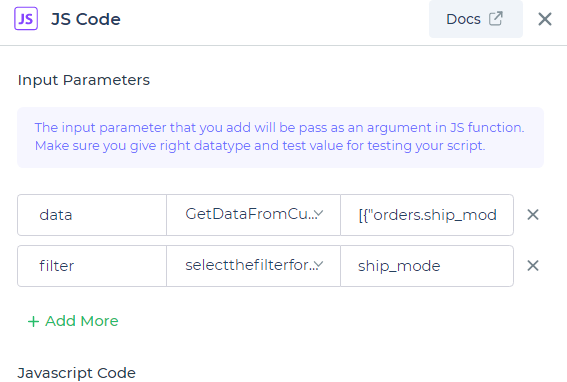
In the JS CODE action block, I will pass two input parameter variables-
1. One will have the output of the API call – GetDataFromCubeJs.Data
2. Another will have the filter attribute option from the charts – selecthefilterfromcharts
Now to filter the output, I have written a JavaScript code as:
CODE:
const monthNames = [“Jan”,”Feb”,”Mar”,”Apr”,”May”,”Jun”,”Jul”,”Aug”,”Sep”,”Oct”,”Nov”,”Dec”];
const colors = [“#1E90FF”,”#00BFFF”,”#87CEEB”,”#B0DBF1″];
const ship_modes = [‘First_Class’, ‘Second_Class’, ‘Same_Day’, ‘Standard_Class’];
let freq = {}, barGraphData = [], month;
data.forEach(e => {
freq[e[‘orders.’ + dataCategorization]] = freq[e[‘orders.’ + dataCategorization]] ? freq[e[‘orders.’ + dataCategorization]] + Number(e[‘orders.count’]) : Number(e[‘orders.count’]);
if(dataCategorization==’ship_mode’) {
month = monthNames[new Date(e[‘orders.order_date’]).getMonth()];
if(barGraphData.length && barGraphData[barGraphData.length – 1].Month==month) {
barGraphData[barGraphData.length – 1][e[‘orders.’ + dataCategorization].replace(‘ ‘,’_’)] = Number(e[‘orders.count’]);
} else {
if(barGraphData.length) {
for(let ele of ship_modes) {
if (!barGraphData[barGraphData.length – 1][ele]) {
barGraphData[barGraphData.length – 1][ele] = 0;
}
}
}
let monthData = {};
monthData[‘Month’] = month;
monthData[e[‘orders.’ + dataCategorization].replace(‘ ‘,’_’)] = Number(e[‘orders.count’]);
barGraphData.push(monthData);
}
}
})
if(dataCategorization == ‘ship_mode’) {
for(let ele of ship_modes) {
if (!barGraphData[barGraphData.length – 1][ele]) {
barGraphData[barGraphData.length – 1][ele] = 0;
}
}
}
dataCategorization = dataCategorization.replace(‘_’,’ ‘);
let dimension = dataCategorization[0].toUpperCase() + dataCategorization.slice(1).toLowerCase();
let tableData = [], pieChartData = [], i = 0, obj;
for(let key of Object.keys(freq).sort()) {
obj = {};
obj[dimension] = key;
obj[‘Count’] = freq[key];
tableData.push(obj);
pieChartData.push({
Dimension: key,
Count: freq[key],
Color: colors[i]
});
i++;
}
output = {tableData, pieChartData, barGraphData};
Test the script and it will observed something like this.
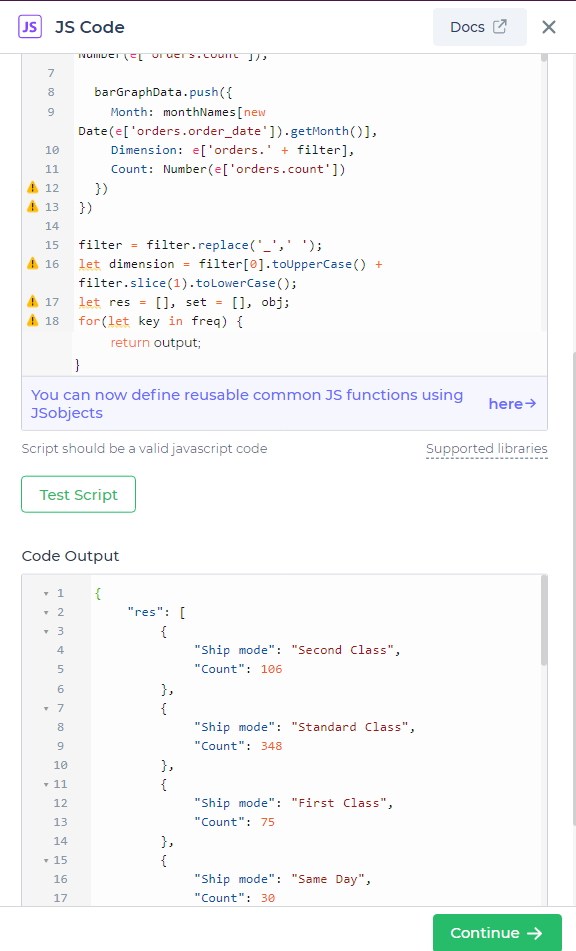
The total output parameters we get are – `tableData`, `pieChartData` and `barGrapghData`, I will now save them in output variables.
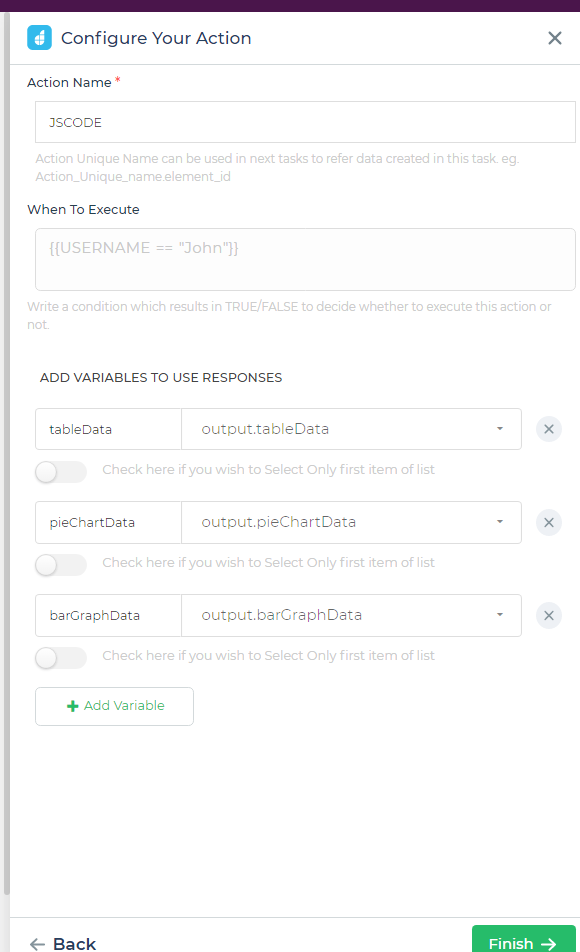
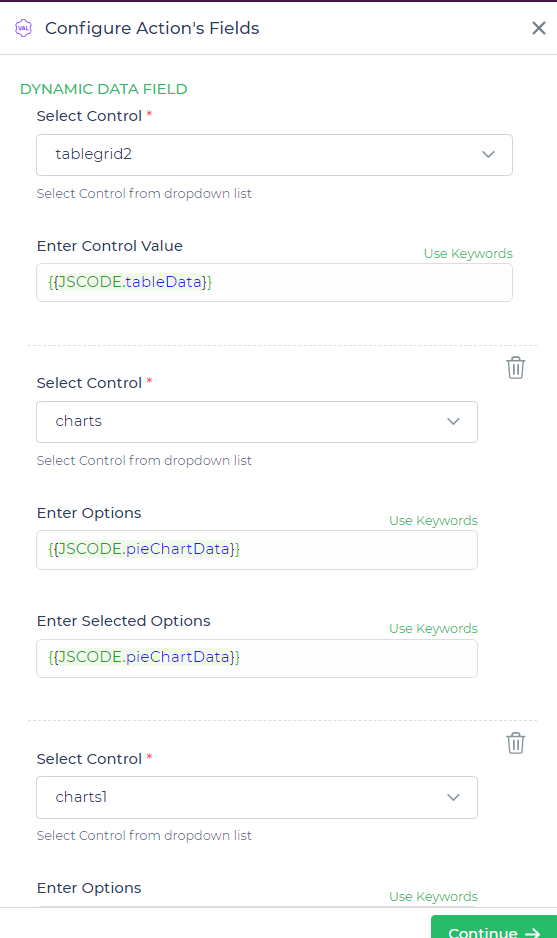
Finally, it’s time to set the data for our illustrative present in the app such as graphs and charts.
I will use the Set Control Value action block.
Here will select my components and pass the output variables using keywords.
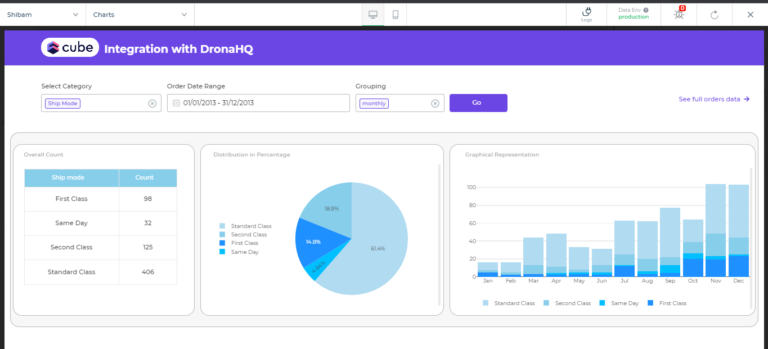
Voila! Our Dashboard App integrated with Cube Cloud on DronaHQ is completed.
Lets preview our apps and provide the filtering and grouping options.
Conclusion
Cube and DronaHQ share a common goal: to simplify the process of creating business applications and minimize the burden of infrastructure maintenance. Together, they empower you to effortlessly develop stunning metrics dashboards and internal tools with minimal coding.
Sign up for Cube and explore DronaHQ today!
Connect with the Cube Community Slack and DronaHQ’s Discord forum to share your feedback on building metrics dashboards.
Related Articles