
Best Elasticsearch GUI clients in 2025
Elasticsearch is a powerful, distributed search and analytics engine widely used across various applications for full-text search, log analysis, and real-time data exploration. But working with Elasticsearch via API or raw query DSL can be overwhelming, especially for those new to its schema-less structure and nested data formats.
GUI clients make this process easier by offering visual interfaces to interact with indices, documents, and clusters, helping both developers and non-technical users get work done faster.
In this guide, we explore the best Elasticsearch GUI tools in 2025 across categories, use cases, and user types.
What makes a great Elasticsearch GUI Client?
A modern Elasticsearch GUI should enable you to:
- Browse and filter documents across indices
- Create, edit, and delete mappings and indices
- Run queries with live previews
- Monitor cluster health, memory usage, and shards
- Visualise trends with charts and dashboards
Some tools are optimised for search development. Others focus on DevOps, monitoring, or cross-team collaboration. Let’s look at the best ones out there.
| Tool | Platforms | Open Source? | Pricing | Key Focus / Features |
| Kibana | Web (self-hosted) | Partially (source-available) | Basic free; X-Pack | Official ES UI; rich analytics & visualisations, dev console, stack management. |
| Grafana | Web (self-hosted or Cloud) | Yes (AGPL v3) | Free OSS; Enterprise plans | Multi-source dashboards and alerts; great for time-series visualisation. |
| Elasticvue | Web, Browser Ext, Desktop | Yes (MIT) | Free and open-source | Developer-friendly ES admin; index/doc browsing, some cluster. |
| Cerebro | Web (self-hosted Scala app) | Yes (MIT) | Free and open-source | Cluster admin dashboard; shard allocation, node stats, index management. |
| ElasticHQ | Web (self-hosted) | Yes (Apache 2.0) | Free and open-source | Comprehensive cluster monitoring & management; multi-cluster support. |
| Dejavu | Web (self-hosted or Docker) | Yes (MIT) | Free and open-source | Data-focused UI; browse & query indices, import/export data via GUI. |
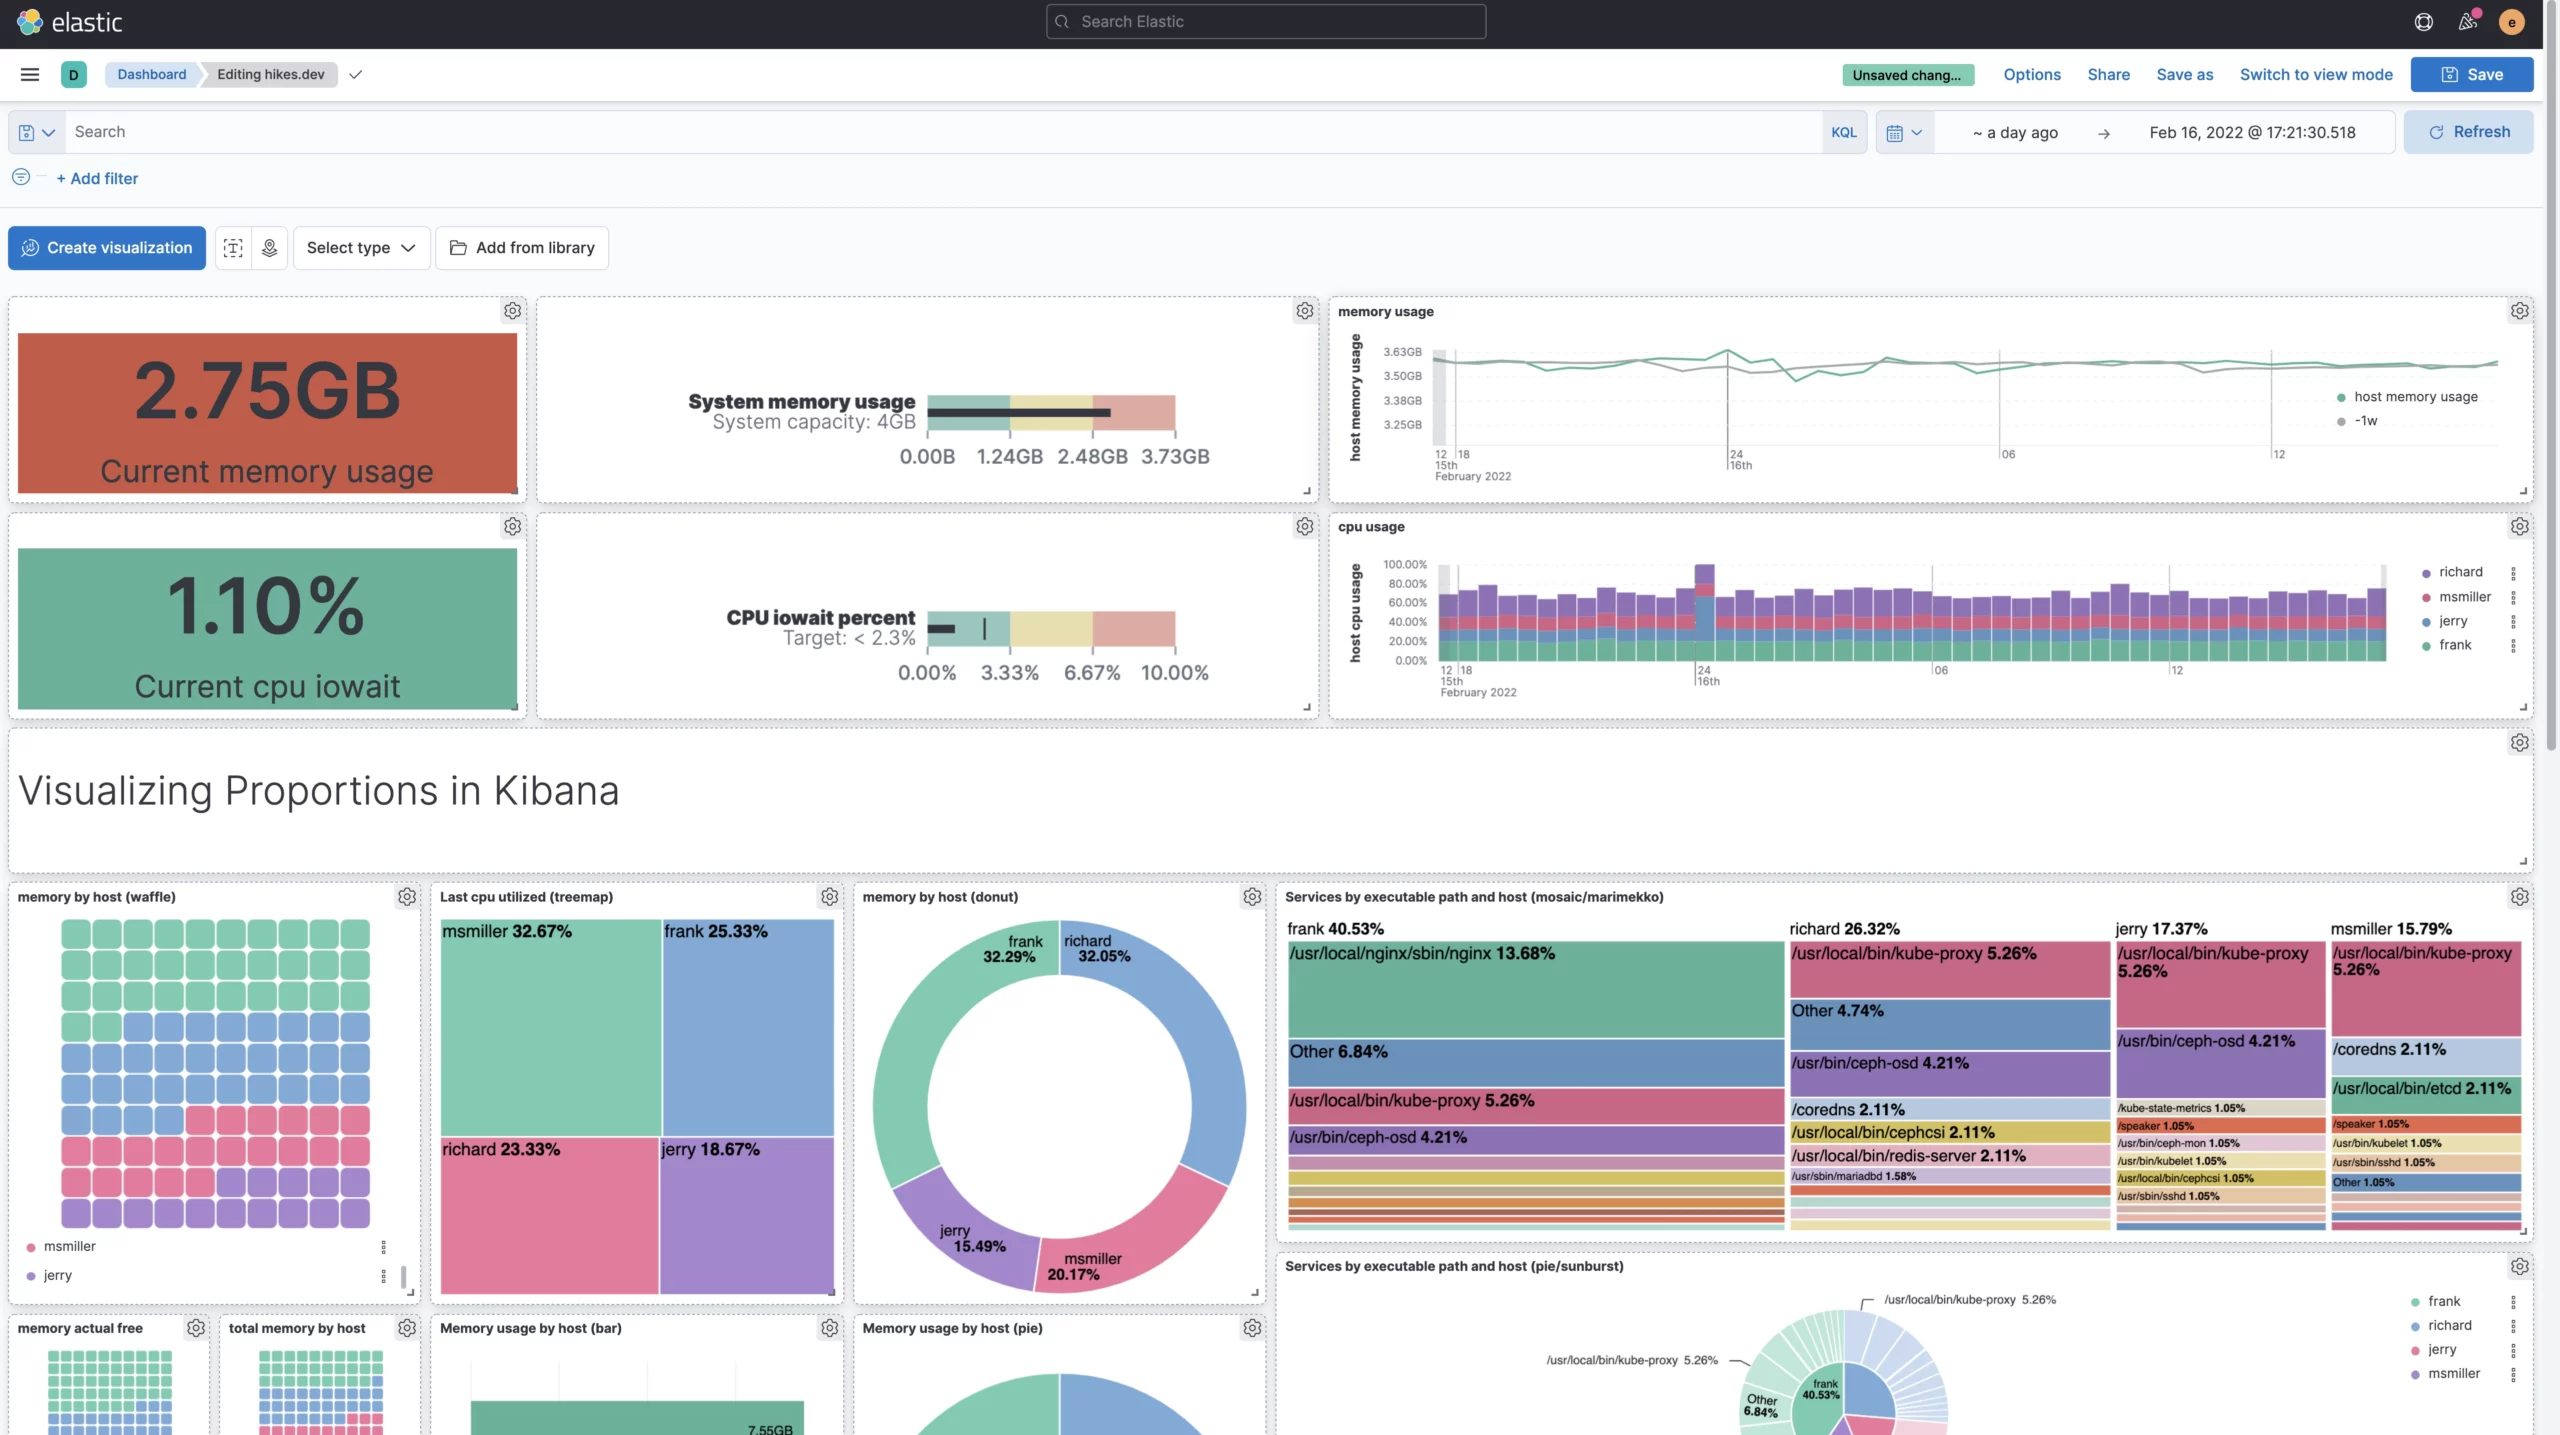
1. Kibana (by Elastic)
Kibana is the official graphical interface for Elasticsearch, part of the Elastic Stack. It lets you search and analyse Elasticsearch data using interactive charts, maps, and dashboards.
Platforms: A Web application that runs on a server and is accessed via a browser. Supports Windows, Linux, and macOS hosting.
License & pricing: Source-available under the Elastic License (SSPL). Core features are free; advanced features such as security, alerting, and machine learning require a paid subscription.
Key features:
- Rich data visualisation with bar charts, line graphs, pie charts, maps, and more
- Real-time exploration of logs and metrics with a query language editor
- Dev tools console for running Elasticsearch API queries directly in the browser
- Management UI for index mappings, lifecycle policies, and role-based access control
- Alerting and dashboard canvas for advanced use cases
Pros:
- Seamless integration with Elasticsearch and full compatibility with all its features
- Extensive out-of-the-box visualisation options for monitoring search data
- Strong support for aggregations and exploration of large datasets in real time
- Regular updates alongside Elasticsearch and a large user community
- Built-in support for GIS maps and time-series analysis
Cons:
- Can be resource-intensive on RAM and CPU for large clusters or complex dashboards
- Steeper learning curve due to query language and index pattern configuration
- Many useful features are available only in the paid tier
- Lacks full administrative GUI functions, such as complete index CRUD
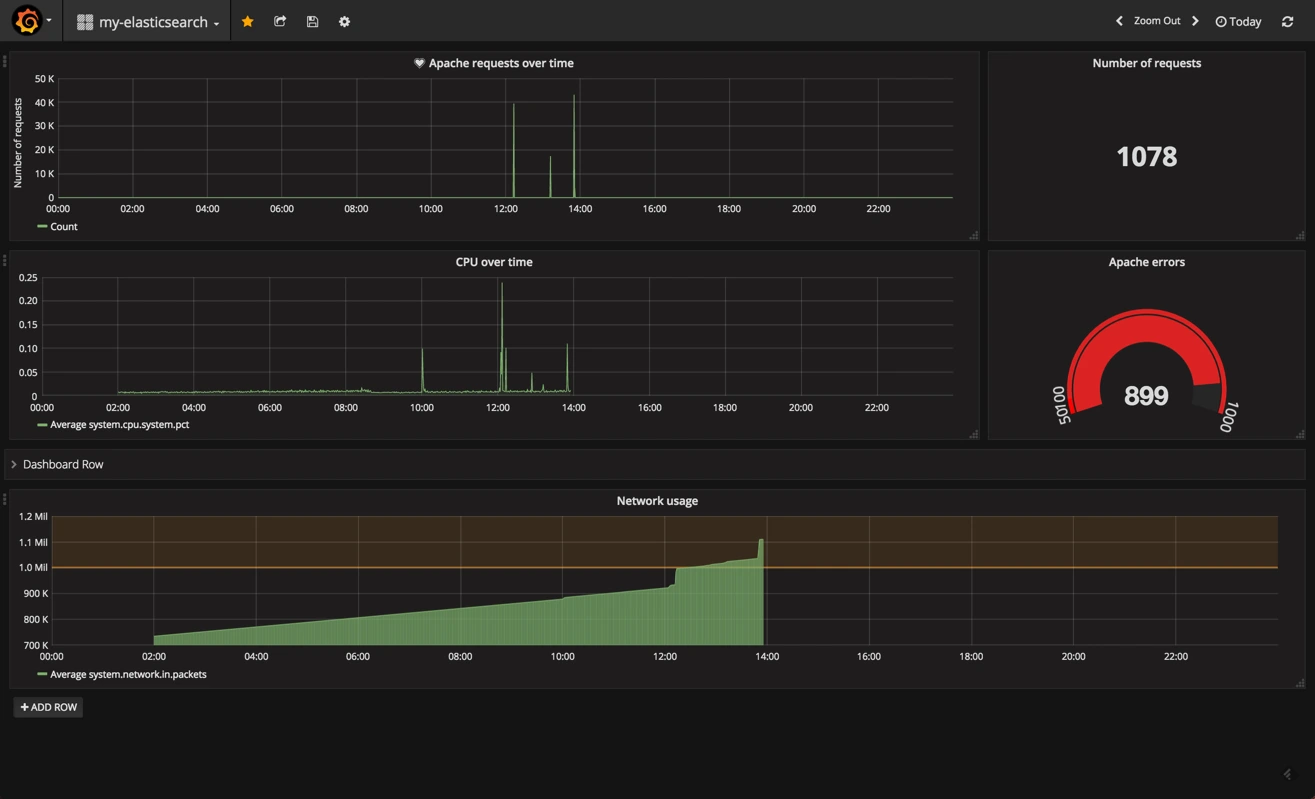
2. Grafana
Grafana is a popular open-source visualisation and monitoring platform that supports Elasticsearch among many other data sources. It excels at creating real-time dashboards, graphs, and alerting.
Platforms: A Web application that runs on a server and is accessed via a browser. Can be self-hosted or used via Grafana Cloud on Windows, Linux, or macOS.
License & pricing: Open-source under AGPL v3 for the core product. Paid enterprise tiers add features like advanced user roles and cloud hosting.
Key features:
- Dashboard builder combining visualisations from multiple data sources
- Powerful alerting system based on query conditions
- Support for ad hoc query variables and template variables
- Visualisation of time-series data is ideal for logs, metrics, and APM
- Plugin ecosystem for tracing, logs, and other extensions
Pros:
- Highly customizable dashboards with a wide variety of chart types
- Multi-data-source support for correlating Elasticsearch data with other systems
- Strong community support and frequent updates
- Built-in, configurable alerting suitable for operations teams
Cons
- The setup for Elasticsearch queries can be complex for newcomers
- Learning curve for building effective queries and dashboards
- Advanced collaboration and long-term data retention features require payment
- Not designed for index management or deeper cluster configuration
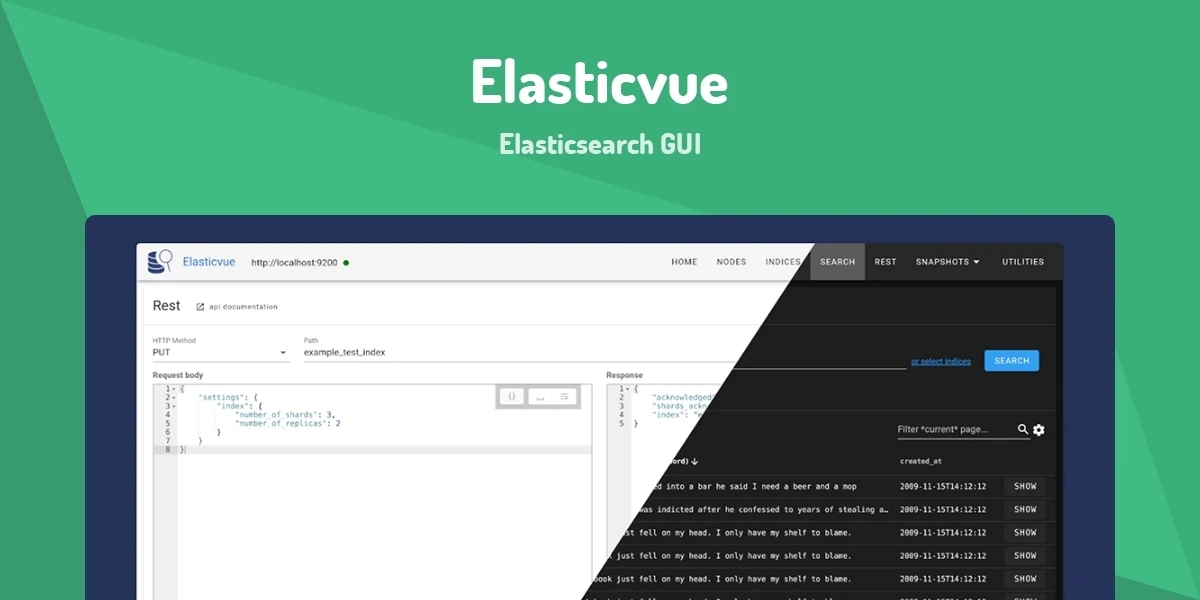
3. Elasticvue
ElasticVue is an open-source Elasticsearch GUI available as a web app, browser extension, or desktop app. It provides an intuitive interface for browsing indices, querying data, and basic cluster management.
Platforms: Web-based self-hosted deployment, Chrome/Firefox extension, or Electron desktop app on Windows, macOS, and Linux.
License & pricing: MIT license, fully free to use.
Key features:
- Index management with a view of mappings, settings, and CRUD operations
- Document search and browsing in a table or JSON view with drill-down
- Cluster overview with nodes, shards, and health status in read-only mode
- Support for all document-level CRUD operations
Pros:
- Modern and intuitive design requiring minimal Elasticsearch expertise
- Developer-friendly focus on data exploration and document operations
- Flexible installation options, including a browser plugin and Docker
- Actively maintained an open-source project
Cons:
- Lacks advanced visualisation or monitoring features
- Cluster management functions are read-only and limited
- May not fully support the latest Elasticsearch security features until updates
4. Cerebro
Cerebro is an open-source web admin tool for monitoring and managing Elasticsearch clusters. It offers quick cluster inspections and basic administration.
Platforms: Self-hosted Java/Scala web application that runs on any server with a JVM.
License & pricing: MIT license, free to use.
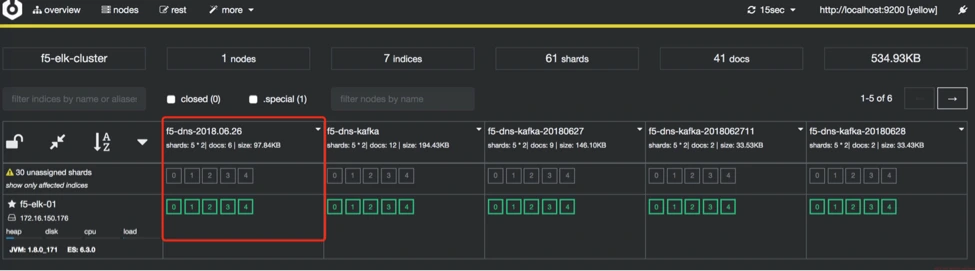
Key features:
- Cluster overview dashboard showing nodes, shard counts, and health status
- Index management with open/close and delete operations
- Shard allocation view for debugging distribution issues
- REST console for simple queries and inspection
- Support for multiple clusters with easy switching
Pros:
- Lightweight and fast-loading admin UI
- Clear presentation of cluster health and performance metrics
- Useful for monitoring shard balancing and slow queries
- Open-source and easy to run internally for security
Cons:
- Utilitarian interface without advanced graphs or custom visuals
- Limited updates in recent years may lack support for the latest Elasticsearch APIs
- Not designed for document-level operations or complex queries
5. ElasticHQ
ElasticHQ is an open-source web application for monitoring and managing Elasticsearch clusters. It provides real-time insights into cluster and node performance as well as query analysis.
Platforms: Self-hosted Python web application accessed via browser.
License & pricing: Apache 2.0 license, free to use.
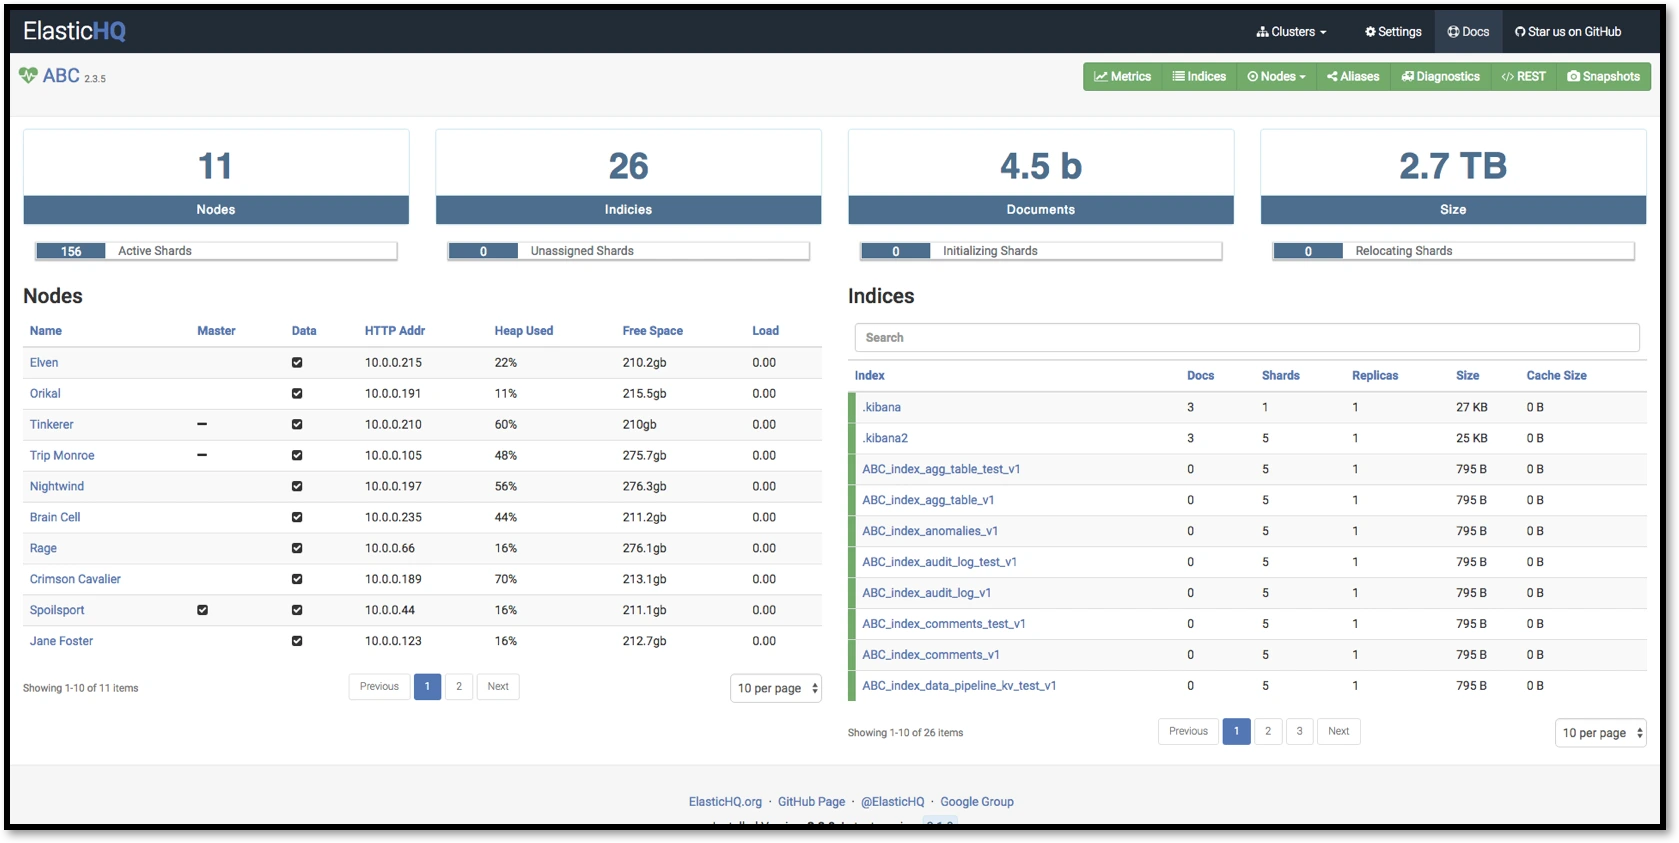
Key features:
- Detailed cluster and node statistics, including CPU, memory, and JVM metrics
- Index management for creating, deleting, and viewing index health and mappings
- Query profiler and analyser for optimising search performance
- Multi-cluster management from a single UI
- Basic security integration via credentials support
Pros:
- A comprehensive set of tools from index management to real-time monitoring
- Battle-tested in production by many large companies
- Straightforward setup and deployment
- Adaptable open-source project for on-premises use
Cons:
- No longer actively maintained, may not support newer Elasticsearch versions fully.
- Potential compatibility issues with recent TLS/SSL configurations
- Feature overlap with Kibana and other tools reduces its unique value
6. Dejavu
Dejavu is an open-source web UI for Elasticsearch and OpenSearch focused on data browsing and editing. It offers import/export and mapping capabilities for developers.
Platforms: Self-hosted web application or Docker container.
License & pricing: MIT license, free to use.
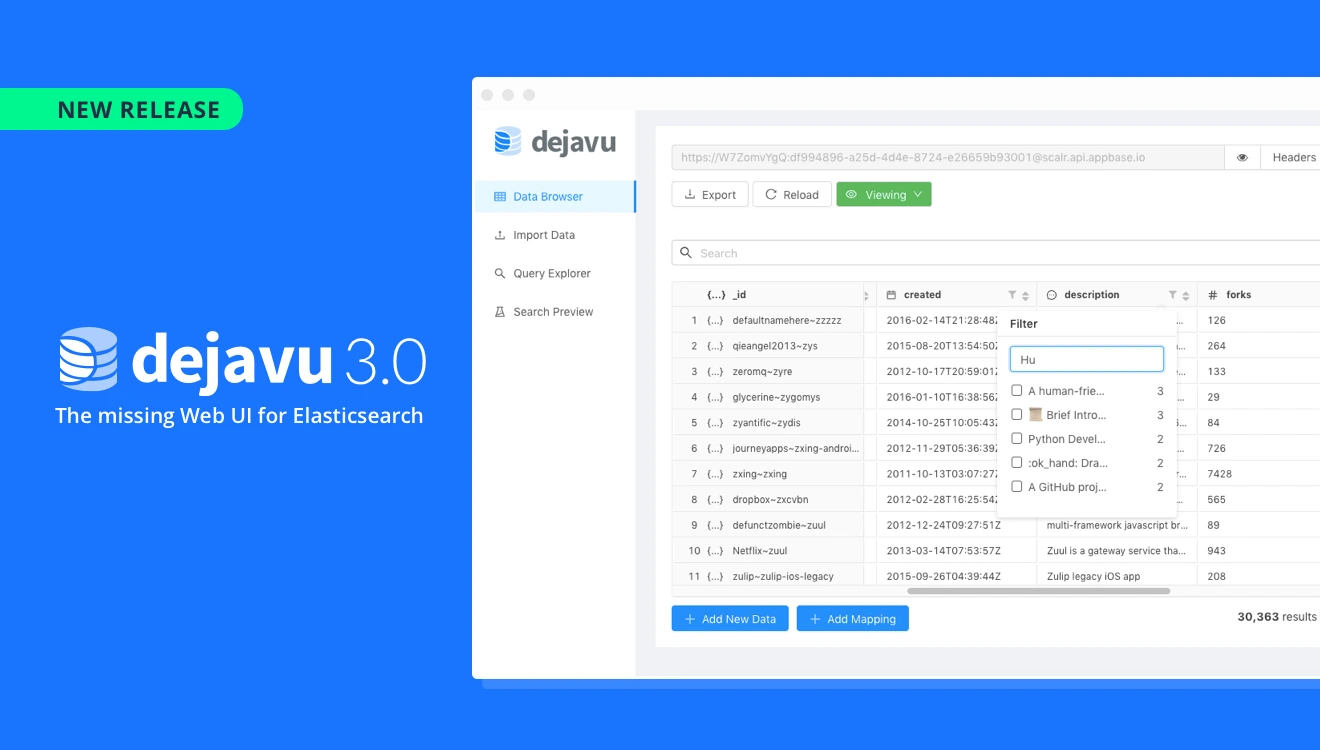
Key features:
- Intuitive index selection and document browsing with pagination and filtering
- Visual query builder alongside direct DSL editing with live updates
- One-click import of JSON or CSV files with field mapping support
- Export of query results to JSON or CSV
- Search preview feature that can generate code for search UIs
Pros:
- Smooth single-page application UI built on React
- Unique support for data import/export and dynamic mapping via GUI
- Actively maintained with support for Elasticsearch and OpenSearch.
- Flexible deployment options for diverse workflows
Cons:
- No cluster monitoring or management features
- Not intended for analytics or large-scale visualisation
- Client-side heavy behaviour can struggle with extremely large indices.
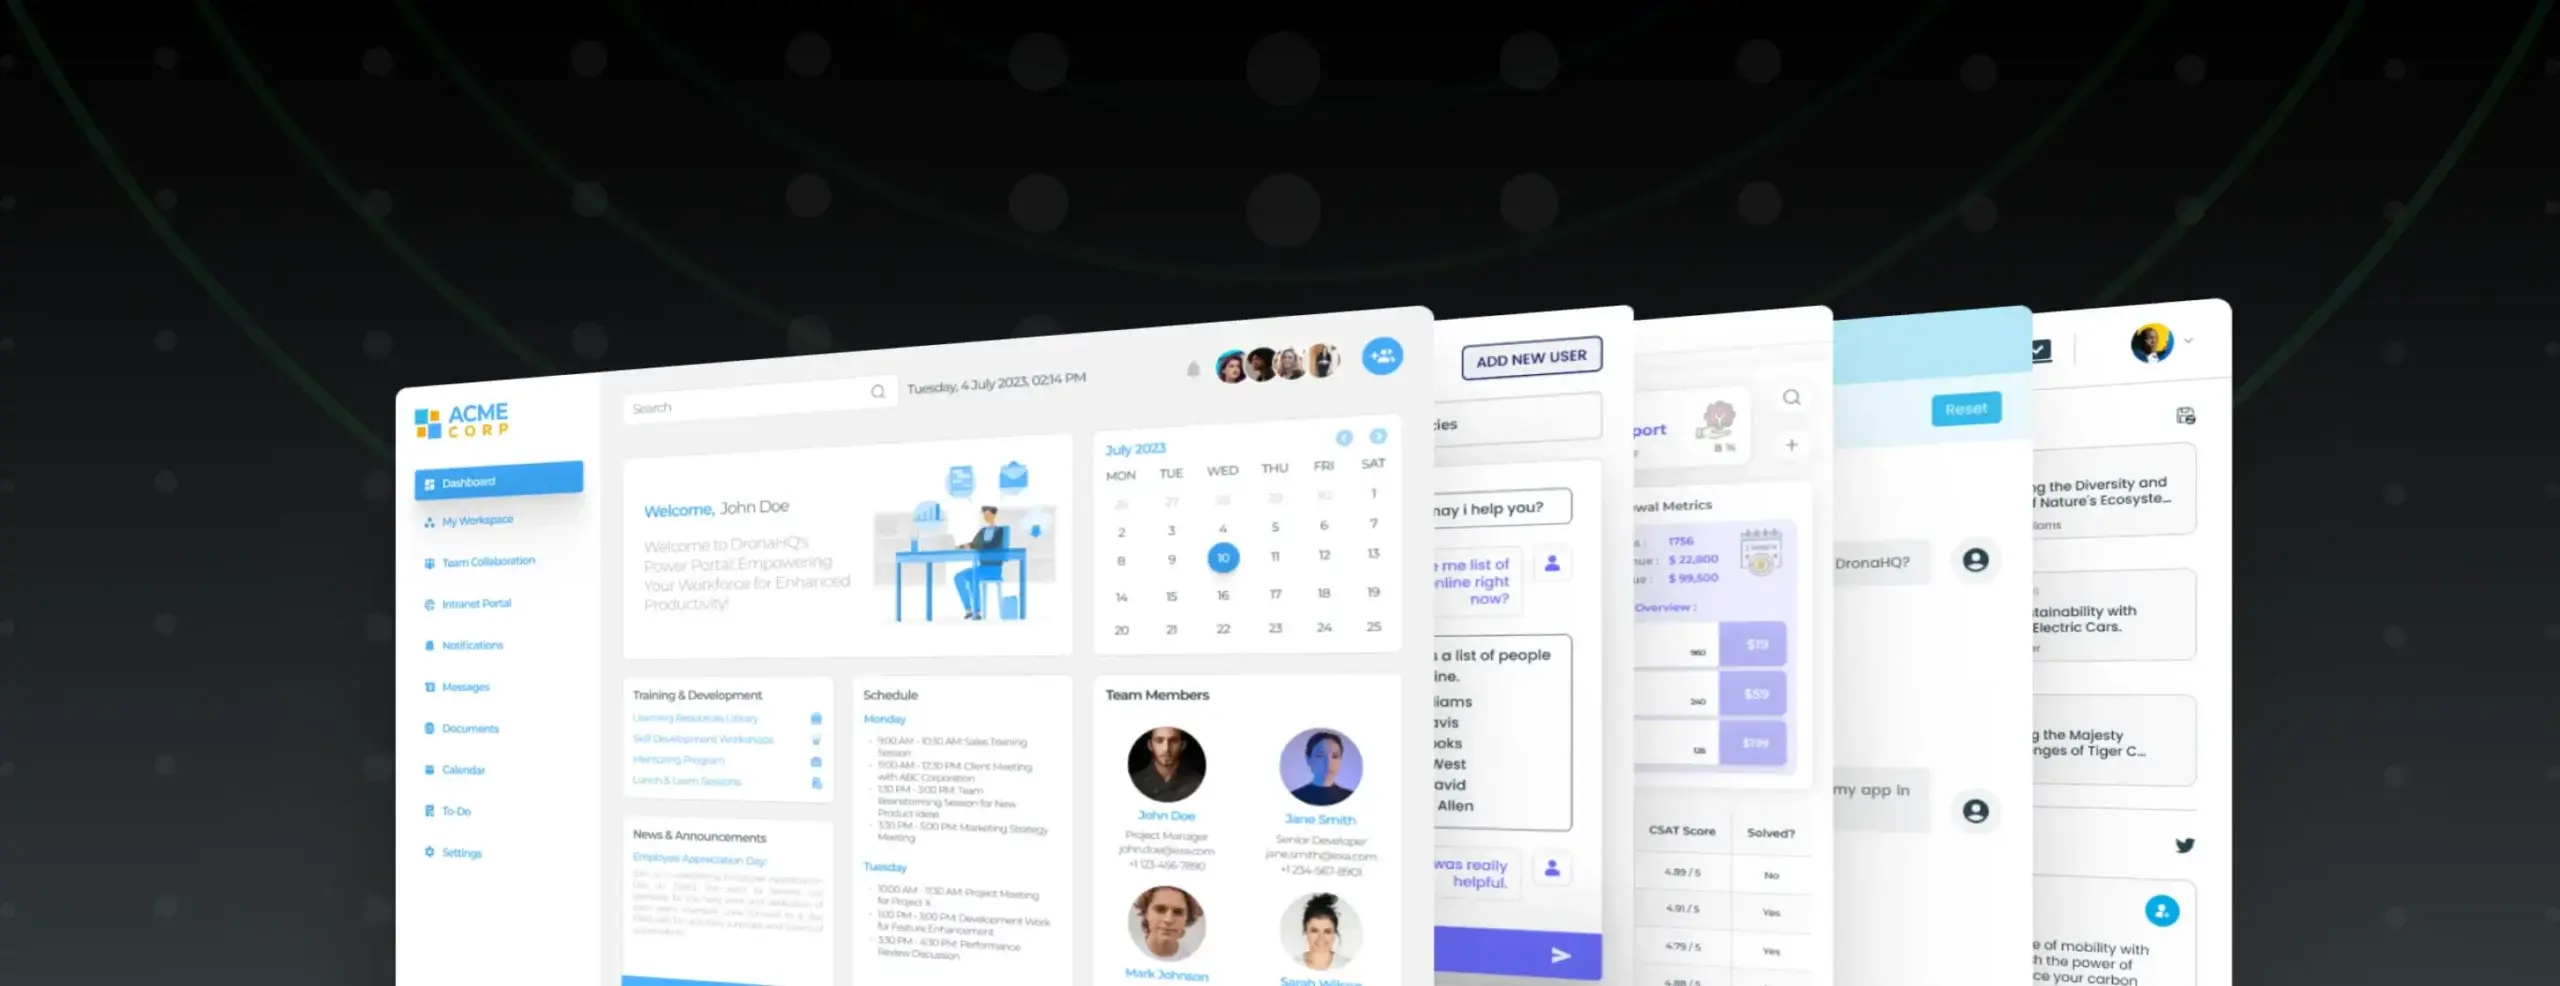
7. DronaHQ for Elasticsearch
DronaHQ offers a unique approach: it allows teams to build customised internal tools powered by Elasticsearch without writing boilerplate UI code.
Best for: Developers and ops teams building Elasticsearch-driven dashboards and tools
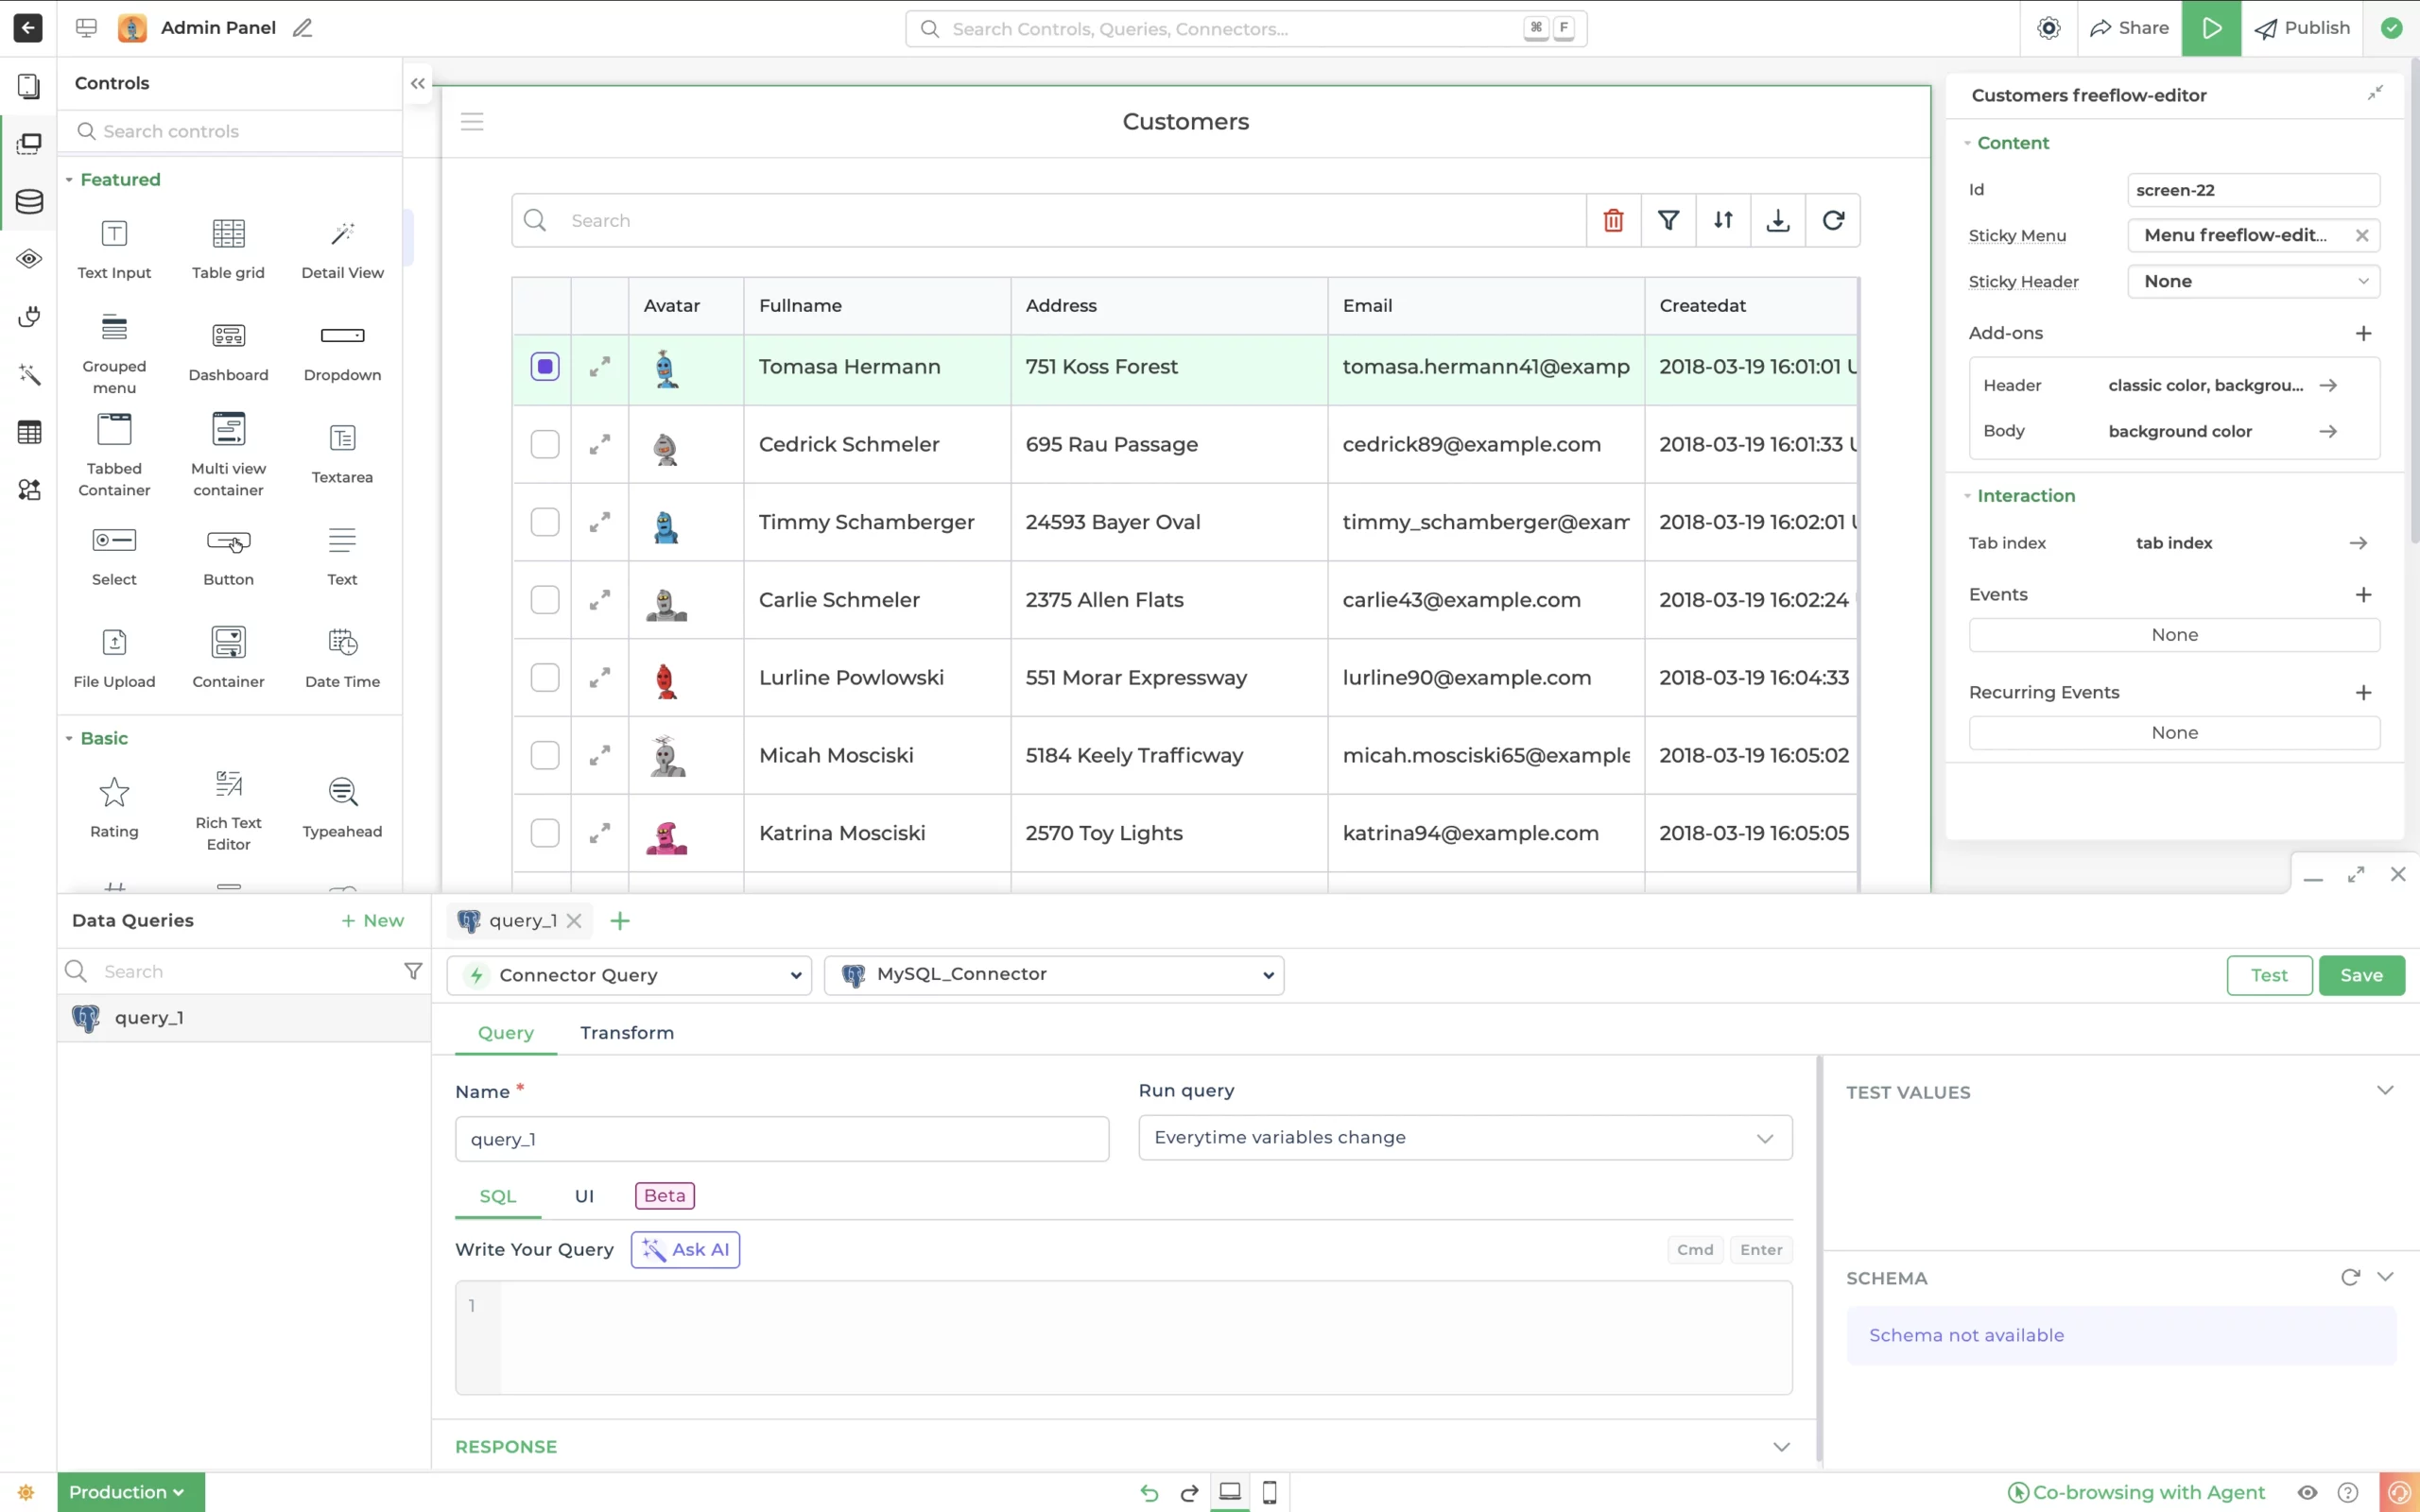
Key Features:
- Native Elasticsearch connector for secure data access
- Drag-and-drop builder for UI, with reusable components like tables, charts, and filters
- AI-powered Vision UI to generate interfaces from text, screenshots, or sketches
- Workflow automation to act on search results or trigger alerts
- Integration with LLMs for conversational query interfaces
- Connect Elasticsearch with APIs, databases, and tools like Slack, Google Sheets, and more
Drawbacks:
- Not a traditional GUI browser, requires basic app setup
Web-based platform for building and deploying internal tools
Final thoughts
Whether you want deep data visualisations with Kibana, lightweight index exploration via ElasticVue, or a more flexible way to build interfaces over Elasticsearch data with DronaHQ, there’s a GUI client to suit your workflow.
For teams that need more than just data browsing like building dashboards, connecting workflows, or adding AI interfaces to your search experience DronaHQ offer serious power without the frontend overhead.
Explore more at dronahq.com.
Related Articles