

How to create a Google Sheets Dashboard with DronaHQ?
Create a Powerful Google Sheets Dashboard with DronaHQ
If you are into fitness, you probably own a smartwatch. There is a different feeling of fulfillment looking at the watch after a long run. You know how many kilometers you have covered, how many calories you have burnt, and how close or far you are from your goal. In short, it helps you keep track of your progress and let you plan your regime accordingly.
The same way it is for your business. Knowing your current status and how far along you have come will help you plan your next moves successfully. And you don’t need a smartwatch for that but a business performance dashboard that will allow you to see what is happening in real-time in context with historical data.
A dashboard gives you a bird’s eye view of the project, enabling users to make data-centric decisions. It visualizes all key metrics to help you track a project’s progress. Dashboards are one of the best tools to extract actionable insights.
Google sheets may be a powerful tool for storing data, but they do not offer any insights or visualization to help owners make business decisions. With DronaHQ, you can build custom dashboards on Google sheets using the drag-and-drop builder in just a few minutes.
Stay tuned to know how you can create a Google sheets dashboard with the help of DronaHQ.
Limitations of Using Google Sheets for Dashboards
Limited automation capacity
You already know how frustrating it can sometimes be to enter every piece of information in the spreadsheet manually. This is because Google Sheets have no automation features. Once a project begins in full swing, it can be hard to function with limited automation capabilities.
Limited integrations
Google sheets offer limited integrations to connect with your favourite productivity tools. The most you can use is a Google extension. Lack of integration capabilities seriously disadvantages you and your team’s productivity.
Not a complete project management tool
Any ongoing project requires a management tool to ensure efficiency, team collaboration, and communication. Google sheets have been a handy tool for small teams or companies, but when it comes to project management on a large scale, it lacks in many areas, including task management, time tracking, communication, and so on.
Limited scalability
Unlike other management tools, Google Sheets does not have the ability to cope with the requirements as the organization grows. It has limited scalability as the number of rows and columns is limited in Google Sheets. Growing and large organizations will have difficulty using it for data visualization and analysis.
How to Create a Dashboard for Google Sheets data with DronaHQ
Follow these simple steps to create a personalized dashboard for Google Sheets data with the help of DronaHQ-
Step 1: Login or signup with DronaHQ
You have to first log in/sign up with DronaHQ to start creating dashboards. If you don’t have an account already, click here to sign up.
Step 2: Connect to Google Sheets
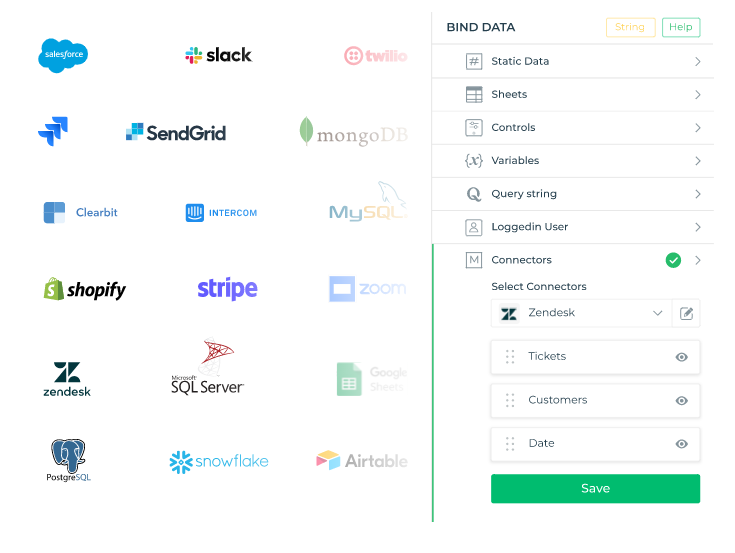
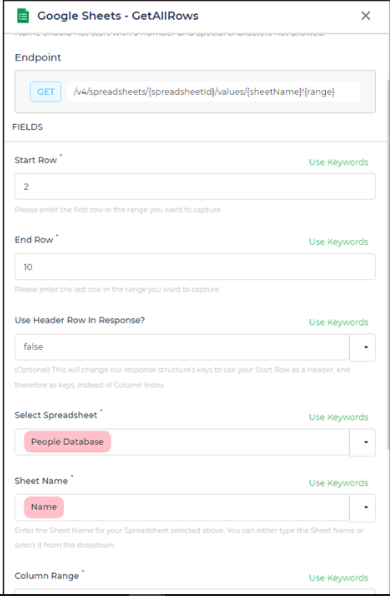
After signing up, you can connect to the Google Sheets from which you wish to extract the desired data. This data could be contacts, emails, or any other listicle. This step ensures that the data you require is quickly accessible to you and pulled out in the front end. You can additionally also pull data from a range of tools like Salesforce, Pipedrive, LinkedIn, Gmail, Zendesk, Slack, and many more to further join it with Google Sheets data and represent it in the dashboard.
Step 3: Transform the datasets as required
You can now write JavaScript codes at the database response to transform the datasets. DronaHQ allows developers to write custom codes to get the desired data transformation outputs.
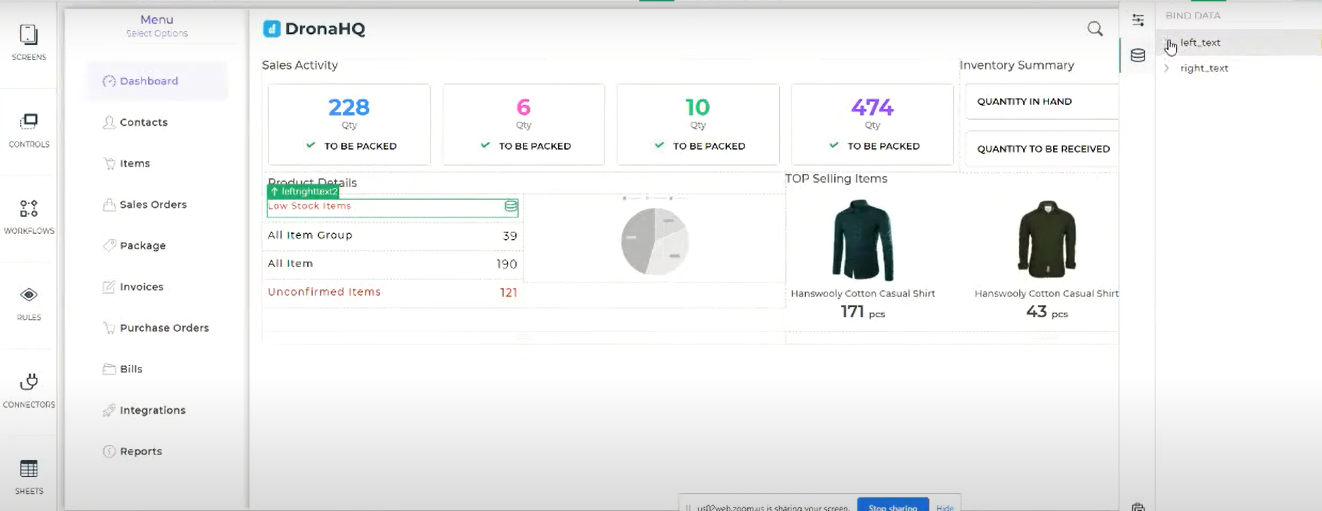
Step 4: Add charts to visualize performance
After the data transformation is complete, you can add different types of charts to your dashboard according to your data type. For example, if you are building a sales dashboard, you can have quick access to different parameters and metrics like revenue per quarter, top sales deals, top customers, profitable channels, etc.
Step 5: Deploy the features and launch the dashboard
Finally, you can deploy all other business-specific features that you may add to the dashboard to align with your requirements. DronaHQ offers the flexibility you need to modify the pre-built sales dashboard. Publish and start sharing the dashboard across your team and users.
Google Sheets Dashboards Customers have also built on DronaHQ
Custom CRM
All CRMs start as spreadsheets, but for how long can you depend on them? Once your customer base increases, it can be difficult to input and track their information manually. You might need automated capabilities, more integrations, and continuous communication. To improve business relationships, you must stay connected to customers, streamline processes and improve profitability. DronaHQ allows you to add custom fields and views to your existing data in Google Sheets with an app.
CRM Dashboards
Once your customer base increases, it can be difficult to input and track their information manually. You might need automated capabilities, more integrations, and continuous communication. DronaHQ not only allows you to build a custom lead management tool on top of your google sheets but design interactive dashboards to track sales KPIs and monitor each stage of your sales funnel effectively.
Sales Dashboard
Build an interactive dashboard for the data-driven sales team to get insights into the sales data and manage inbound salesforce leads from a single view allowing teams to accurately forecast demand, drive new lead ideas, and convert more sales. Build a custom frontend on top of the sales sheet that can help you create interactive experiences like adding notes, transforming lead data for MQL or SQL activities, create role-based views of the data while keeping underlying data untouched.
Customer order dashboard
A customer order dashboard offers you full visibility of orders and products in one single view. Fetch customer and order data from API or any other data source, add search, details, and analytics. You can also view the statuses of processes like shipping, delivery tracking, return order status, and so on.
Inventory dashboard
Inventory dashboards on Google Sheets are popular among business users to stay organized and visualize their stock in one place. Users can also add new SKUs, track the status of orders and place new ones, approve discounts, and so on. Users have also built a custom admin panel on top of Google Sheers with basic CRUD operations to ensure there is no risk of data manipulation or errors.
Employee dashboard
Connect to your existing data sources and databases and visualize the status of employee onboarding seamlessly on google sheets. It will allow you to keep track of all employee activities and documentation.
Create Intuitive Dashboards with DronaHQ
Save hundreds of hours with DronaHQ by building custom Google Sheets dashboards and apps, admin panels, and dashboards in the fastest way possible in a secure and reliable way. DronaHQ enables users to build interactive user interfaces and rich user experiences with pre-built controls, buttons to run API requests, visibility rules, and more. It offers 100+ UI components to visualise and access Google Sheets data, including table grids, charts, dashboards, cards, and form controls to configure pixel-perfect responsive layouts.
DronaHQ simplifies dashboard designing issues in Google Sheets with the following elements-
Drag and drop builder- Don’t build from scratch. DronaHQ offers 100+ responsive, reusable, powerful out-of-the-box components enabling building beautiful interfaces in a straightforward and quick manner.
Action flow builder – Users can configure action flows to perform actions like validating screens, firing queries into databases, calling APIs, etc, upon on-screen events.
Web+mobile responsive- Allows users to publish, manage, update, rollback, invite, embed with the device, and access specific settings easily.
Customization- Create your own custom UI components and functions using JavaScript which can be used across all the dashboards you build on DronaHQ. Further you can write JavaScript to transform your API responses received.
Role Based views and user management- Protect data integrity by allowing only authorized user access to sensitive data and manage how a user uses your data with login authentication, email verification, user roles, and permissions.
Integrations-Smoothly manage data fetching. Integrate with any API, databases, and multiple third-party applications. Visualize multiple data sources in the same view.
Sign up now to get a 14-day free trial for the starter plan!