

Understanding and Building Airtable Reports on Low Code
What are Airtable reports?
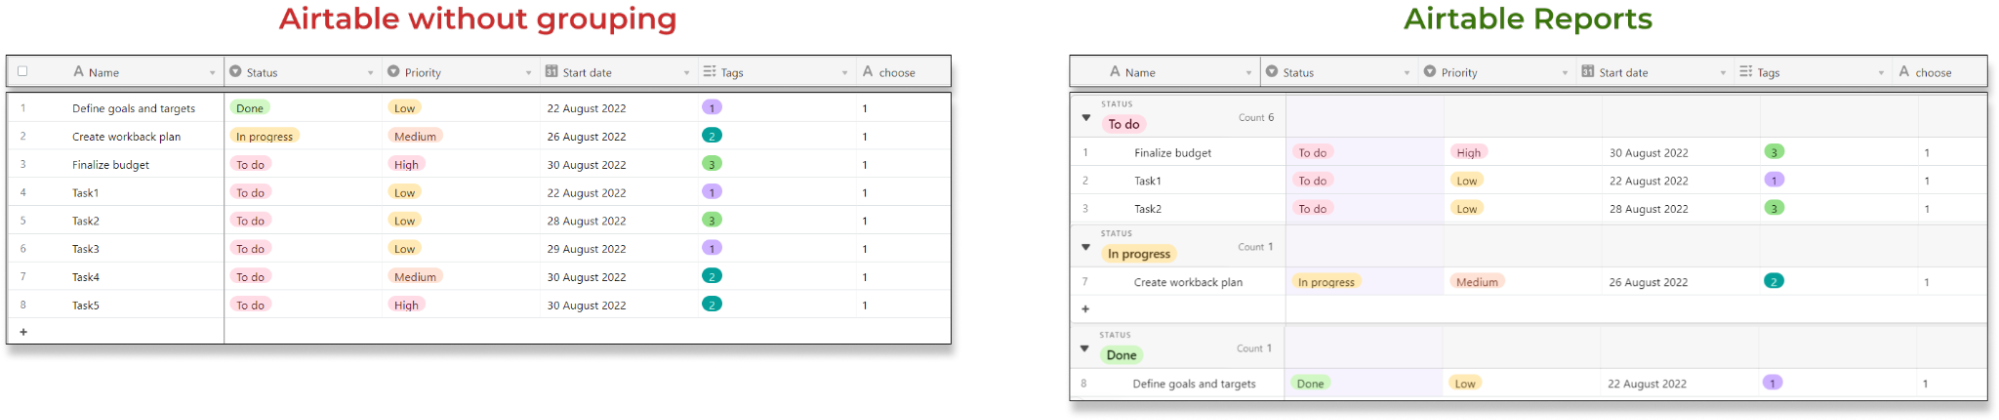
Airtable report is not a separate section that you will find in Airtable. It is Airtable’s grouped records feature that allows you to display your records grouped based on one (or more) field of your choosing.
For reference, in the above illustration, we can observe that on the left side we have the table displayed by default and on the right, we have grouped the records by status field.
Limitations of using Airtable for reports:
- There are users who have reported a higher learning curve for Airtable. Even if the user knows Excel well, it may not be very easy to navigate the software for various reasons. More specifically, the process of copying/pasting and highlighting cells is not as easy as in Excel. Although there are introductory videos and templates, many of them are not very useful for users.
- Although Airtable is supposed to work similarly to Excel, users seem to find creating formulas difficult. Many of them would prefer the software to have its own formula builder
- Payment types are not very friendly. Airtable charges per user instead of per organization. This makes it more expensive than other similar online collaboration tools. Even though these users all work for the same project and team, they are charged individually for using Airtable.
Benefits of using DronaHQ:
- DronaHQ provides you with more than 200 rich UI controls with every control having an option for custom formula, where user can write their own formula for displaying the data; and more than 100 database and ready connectors. Also, DronaHQ offers community support with documentation and guides for almost all connectors and controls, making it easy for users to understand and build applications quickly.
- DronaHQ offers rule-based visibility, you can hide/show individual data visualization elements by applying the criteria for display.
- With DronaHQ you can control the access of applications using role-based views.
- DronaHQ provides a user-based pricing model starting from as low as $10 per user per month for starter plan.
How to create Airtable reports on DronaHQ?
Let’s look briefly at how can we create Airtable reports on DronaHQ
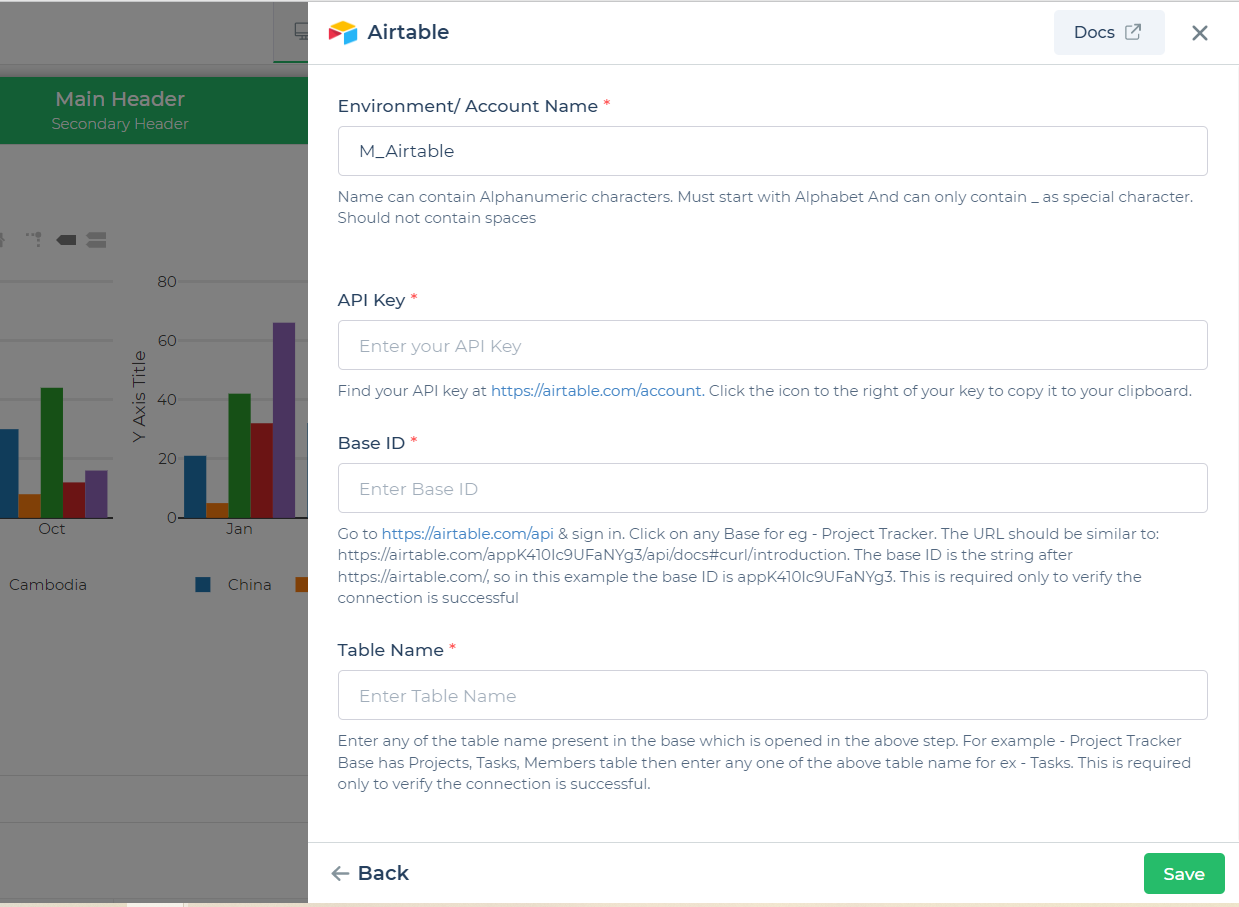
The first step is to integrate the Airtable connector in DronaHQ with our Airtable account. It requires the details such as API Key, Base ID and Table Name which are easy to figure out by the reference given for each field
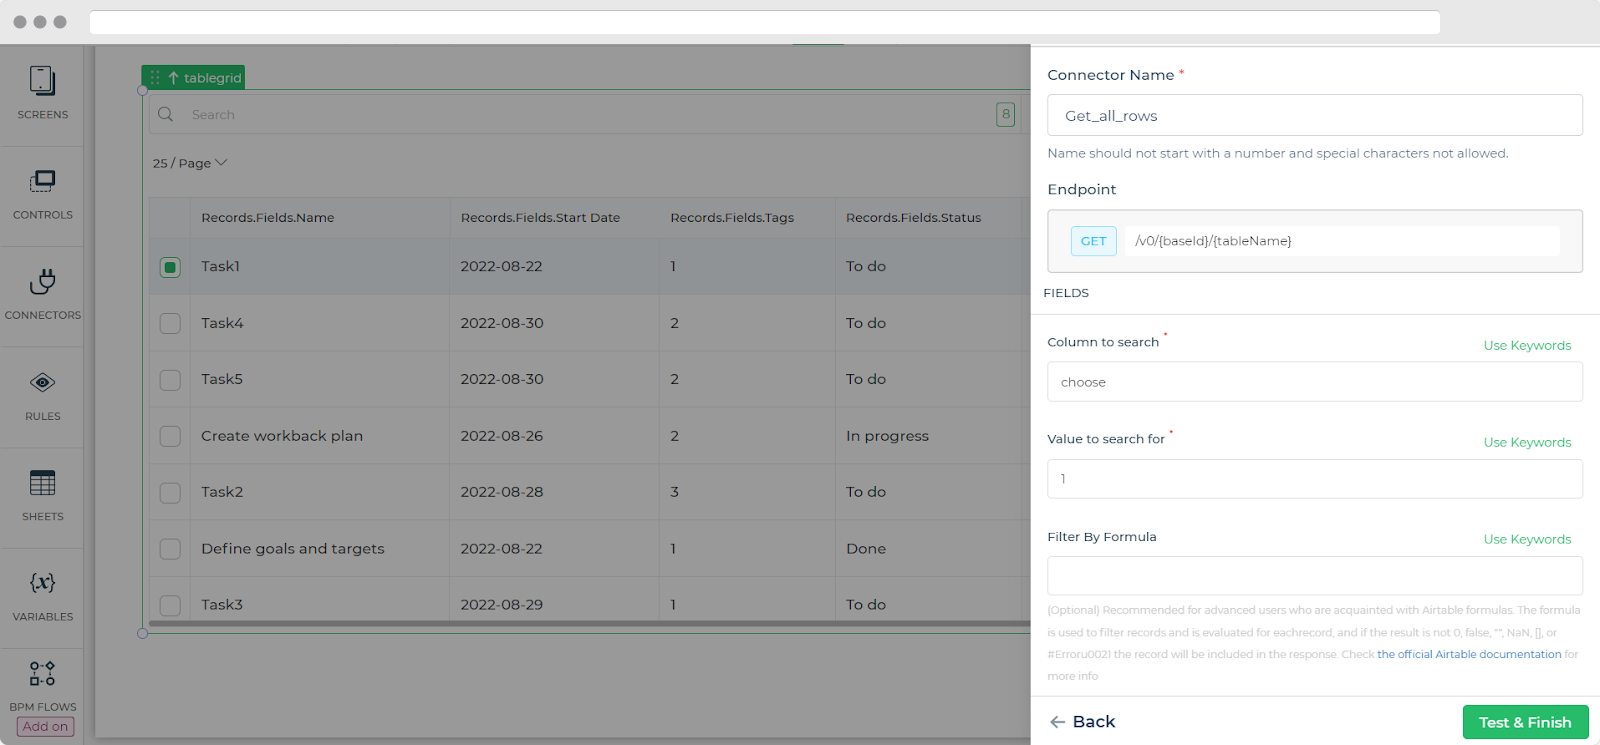
For creating Airtable reports we can use a Table-grid control. In the table Grid control, for fetching the data from Airtable, go to the data tab and click on the connector. Select the Airtable Connector and fill in the required details
Then for creating Airtable reports in DronaHQ we need to use the group by property of Table Grid.
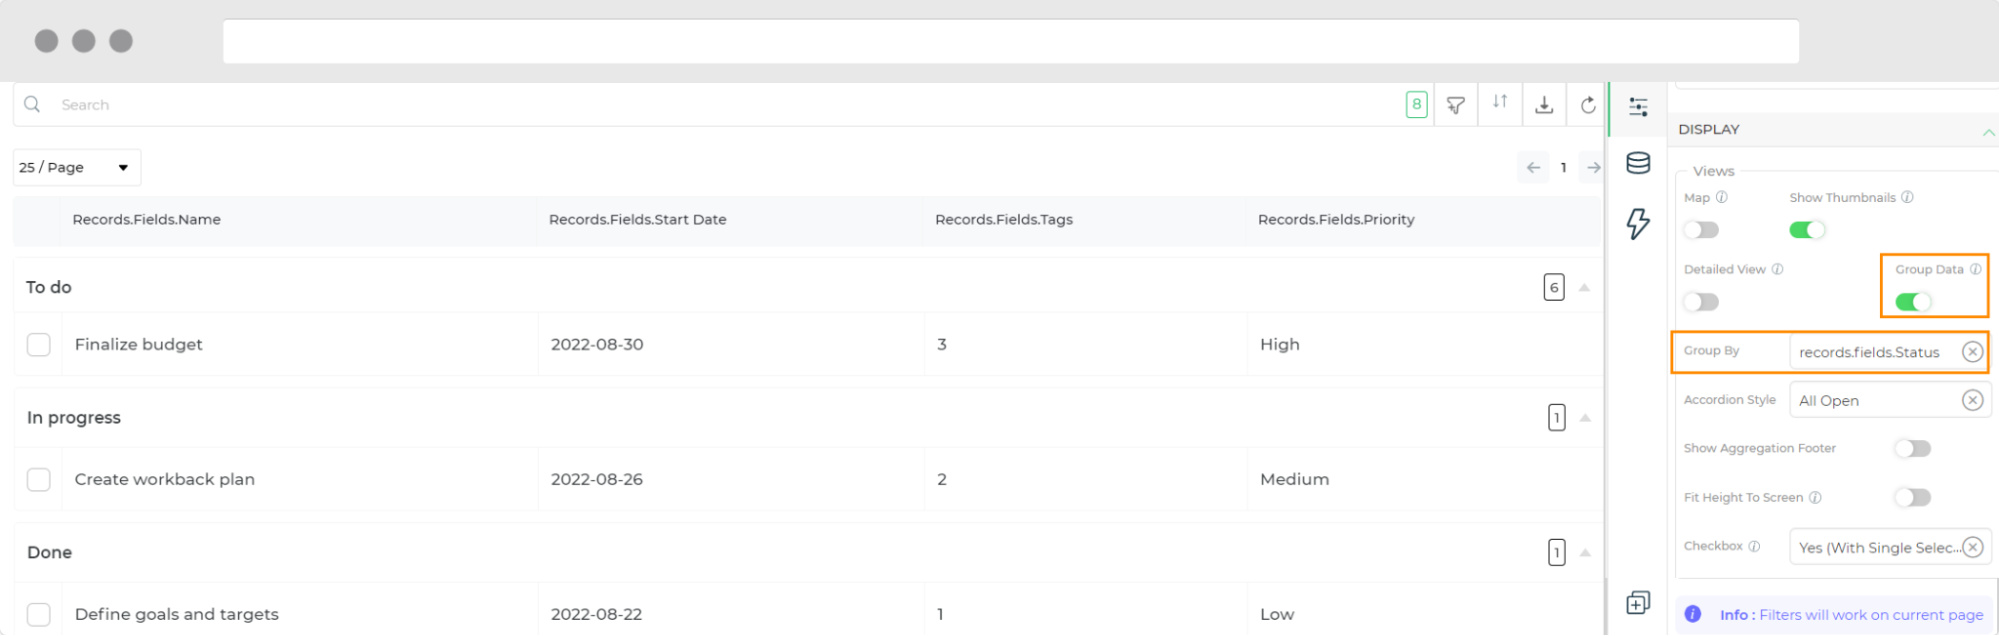
The above table is what we called Airtable Reports built using DronaHQ.
Examples of reports in Airtable
Airtable reports can be used for many different use-cases. Let’s discuss some of them
- Task Management Report: Businesses use task management tools to track team performance. A task management table can contain fields like Task Status, Task Name, Due Date, Task Priority, etc. Creating Airtable reports by grouping records based on task status and priority will separate important tasks from other tasks and improve readability.
- Campaign Tracker: Marketing campaigns promote products through various media sources such as radio, television, print and online platforms. Airtable reports can help businesses in tracking the performance of Campaigns by grouping the records by ROI field.
- Product Launch: In general, a product launch involves a set of dependent events that organizations iteratively re-engineer and re-prototype before the actual market launch. Teams can benefit by prioritizing the features using Airtable reports by grouping the records by the status and their OKR respectively.
- Sales CRM: Customer relationship management (CRM) is used to manage an organization’s relationships and interactions with customers. It helps businesses stay connected with customers, improve profitability and streamline processes. Creating an Airtable report by grouping leads based on priority will help teams focus on prioritized leads.
In addition to creating data representation tool, there are role based views by which you can create drill down reports ie, click on an element to get deeper insights, based on the end user they can gather more details pertaining to their tasks – kanban views
Choose DronaHQ for Airtable reporting
Airtable is a popular SaaS tool to easily manage data. While we love how fun it is to use, there are situations when we need to share the Airtable data with users in a controlled way or combine data from Airtable with other sources. Another drawback some customers share about working with Airtable is that the Airtable APIs allow you to only access 100 rows of data.
With DronaHQ you can build Airtable reports in just a few minutes and access any number of rows of data, be it 100, 1000, or 1 million rows of data. With over 100+ built-in controls and ready connectors, you can build an interactive application.
Features of DronaHQ:
- Role-based access
- Usage-based pricing
- Rule-based visibility
- Web & Mobile Output
- Public cloud, Private cloud, on-premise deployment options
- Enterprise-grade security
Simultaneously do not forget to request a demo on DronaHQ for free right now!