
Real People, Real Stories: Generating Infographic ROI Report
Here’s my story on how I automate PDF report generation for this low-code ROI calculator.
Introduction
As we all know, return on investment, better known as ROI, is a key performance indicator (KPI) that businesses often use to determine an expenditure’s profitability. It’s exceptionally useful for measuring success over time and taking the guesswork out of future business decisions. The ability to calculate return on investment is precious for any business, regardless of size or industry.
After all, knowing if we’re getting our money’s worth is a fundamental concept that both individuals and businesses need to understand to strengthen — rather than hinder — financial success.
At DronaHQ, we aimed at offering an ROI calculator as a tool to help IT leaders, application managers, CIOs, digital consultants, and business teams estimate/understand the potential time and cost savings that you could achieve with the low-code applications of DronaHQ.
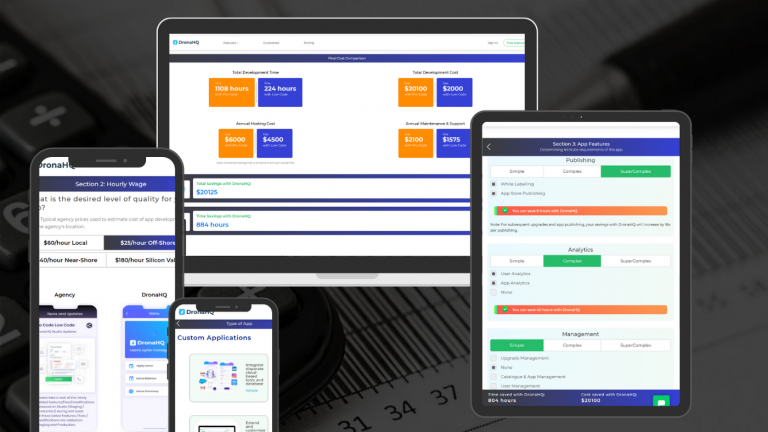
The calculator has five critical sections –
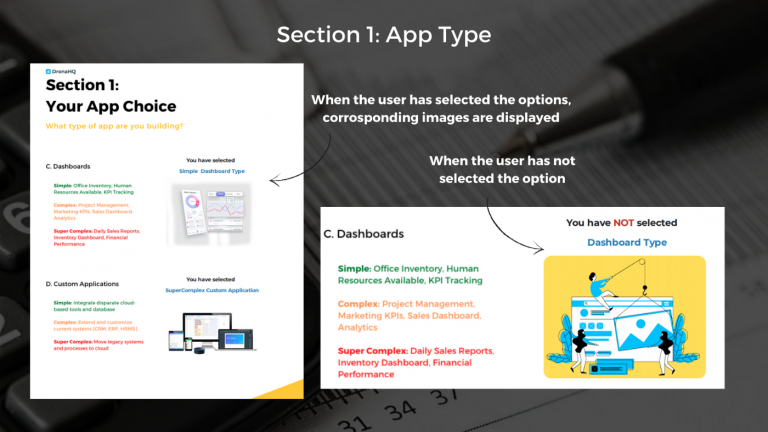
- App Choice: The type of app to build includes the basic functionalities like form-type, process automation, kind of dashboard, or fully customized app.
- App Quality: The hourly wage willing to give for the desired level of app quality.
- App Features: The features an app should have, for example, which devices it should work on, type of frontend designs, business logics, management parameters, analytics, security levels, and much more.
- App Hosting Charges: The number of users that will use the app.
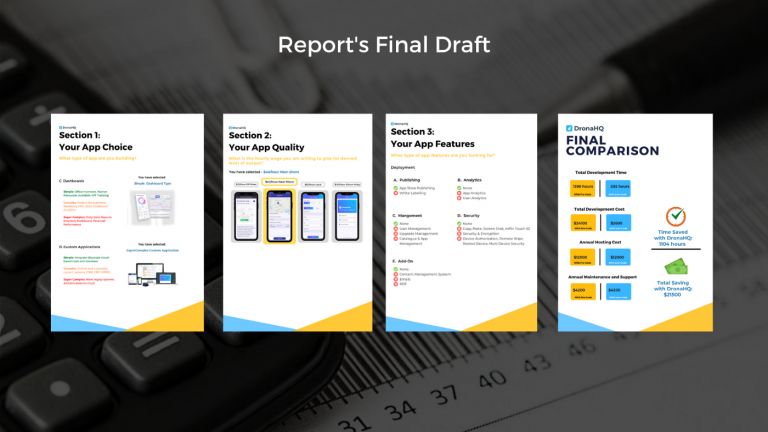
- Final Comparison: Towards the end, the calculator compares the time and money required to build the app by pro-code and low-code application development.
This tool is a handy and useful tool that many people and organizations use to find out what they are losing while working with pro-code and what they can gain if they work with low-code application development.
Often, we come across such excellent tools, but we are not the decision-makers. We need a simple yet efficient way to share our findings with our teams for further discussion or decision-making. So the obvious solution was to email a pdf report to ourselves and our team with all the details captured.
Thus, my goal was to save and share the final report whenever a person uses the ROI calculator.
And I chose to make the PDF report using the low-code tool itself, making this a perfect use-case itself.
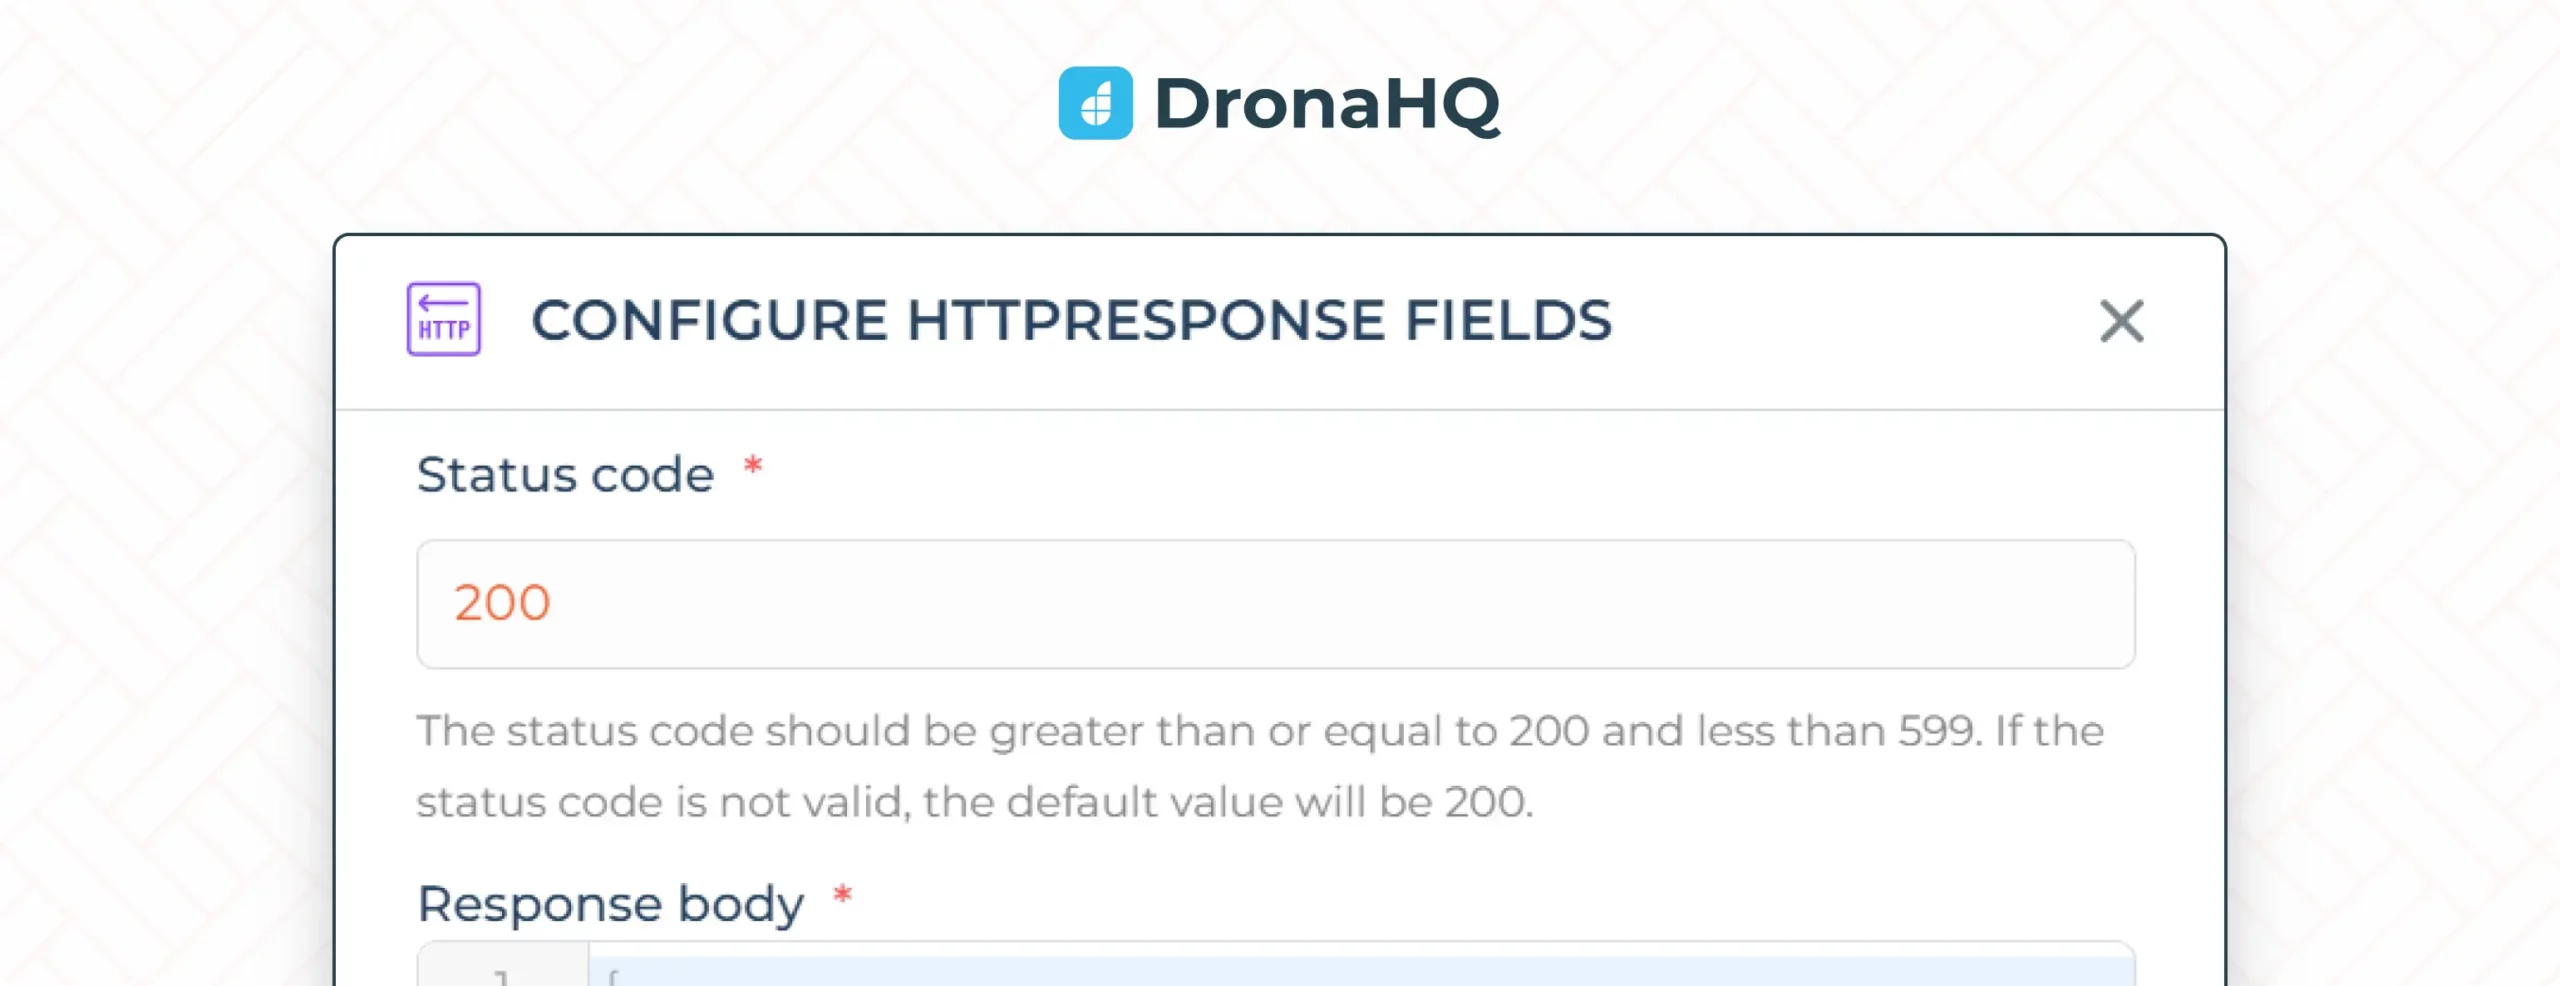
How did I make the pdf?
DronaHQ provides a PDF Creator tool in which we can build a template for our report. It has five types of variables – text, image, list text, list image, and summary control variable. It also provides different layouts and elements that we can use – number of columns, spacer bar, separators, headings, tables, etc.
The first draft of the report was a simple and straightforward attempt, with tabular information and some background.
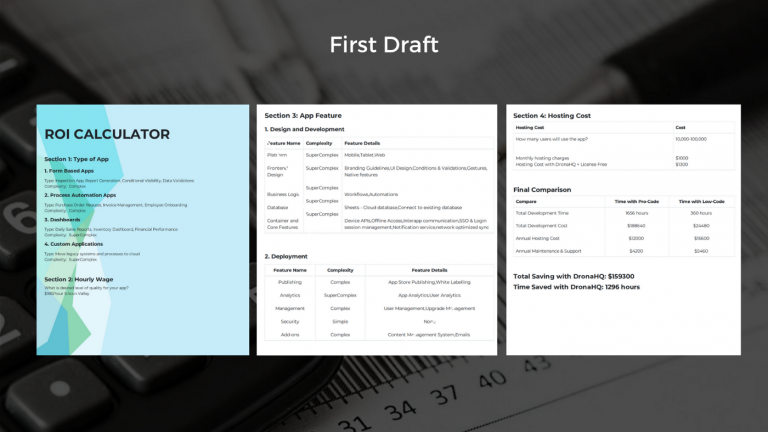
But, I wanted to build a report which is visually appealing and easy to read.
The first and foremost challenge I faced was for section 1 (app choice). In this section, there are four sub-sections – form-based, process automation, type of dashboard, and custom applications, each having three options to choose from. The idea was to display a specific image for one particular choice (12 photos). The tricky part being, the user can skip any section he/she wants. So when the user has skipped any sub-section, the image should be telling that you have not selected any option here. Here I used a conditional logic of “IF” – if the user has selected display the intended image, else the default one (chosen not one).
The next challenge was the most time-consuming part of this process. Creating an aesthetically pleasing report came with further development that it should show all the checkboxes the calculator has and highlight the user’s selected ones.
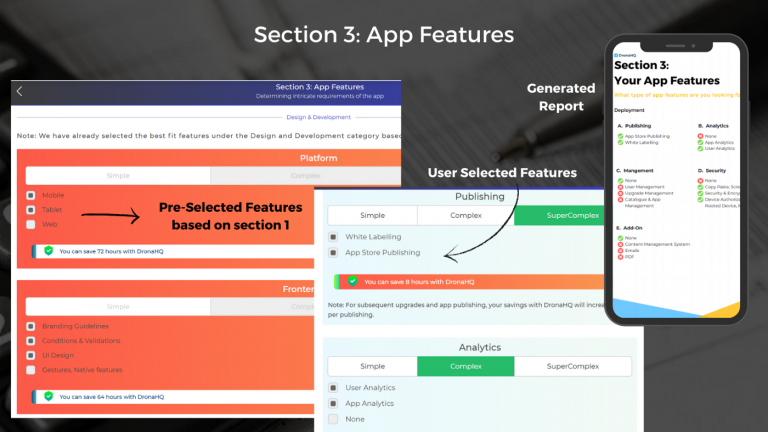
This will give a complete understanding of the features and functionality selected for the app and the functionality opted out, providing a holistic view of the platform and requirements. This challenge was mainly for section 3 (app features), which contained checkboxes. The ROI calculator app only collects the user’s selected value (and it couldn’t differentiate with those that are not selected). After many different failed attempts, my colleagues and I found a way to approach this problem. The background of the report is an image that contains all the features available in the checkboxes. I used image control variables (the same number as the number of feature checkboxes). Further, the studio provides the functionality to get the features that the user has selected. I just mapped each of the image variables to the chosen features where one of the two images – one green tick and a red cross will appear according to the user’s choice.
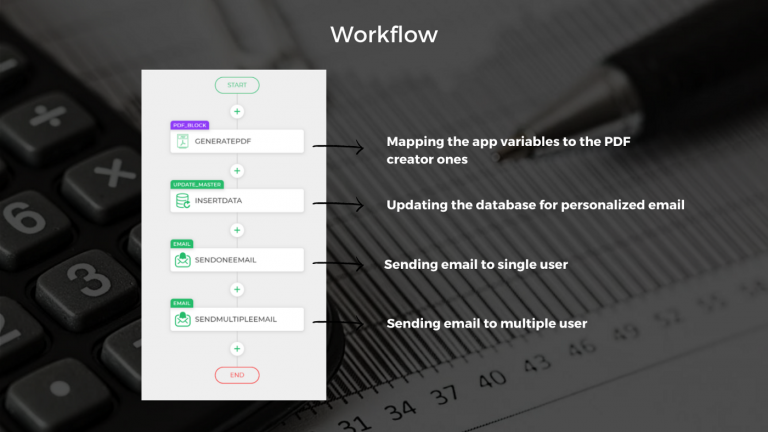
In the workflow (shown below), there are only four tasks that need to be executed –
- Generating the pdf report by mapping the pdf creator variables to the control variables used in the app
- Getting the name and email of the user, for personalized email
- If the user wants to send the report to his colleagues, they can enter their respective email IDs, along with a custom message to go with the report.
- Sending an email to the user (and colleagues, if chosen) with the report attached
Conclusion
It doesn’t matter if you’re a hiring manager, a director of marketing, or a CEO; every business decision requires ROI knowledge. If you’re not sure whether your efforts are yielding results, how can you properly optimize profitability? Understanding the importance of ROI is crucial for any business to succeed.
This ROI calculator app, the PDF report generated, and the workflow for sending the emails would not be possible without coding, thanks to low-code platforms.
Making a PDF report as fantastic as an infographic one, along with the feature of making it shareable with colleagues, is not something I imagined I would be able to achieve as a non-technical person. But this experience has helped me to be shaped into a low-code enthusiast. It made me realize the power of no-code/low-code application development platforms. Low-code technology is as easy and as promising as it sounds. The DronaHQ Studio interface is incredibly user-friendly, containing the drag and drop UI builder and point and click interface for workflows and automation.
Here are some snippets of the generated infographic report for the ROI calculator –
Do access the ROI calculator app, try out the report, and share your feedback. Let me know how you would have done it, which platform or tools you would have used.
Feel free to share your stories with us.
Originally published at Medium.
Related Articles